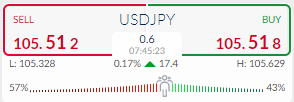
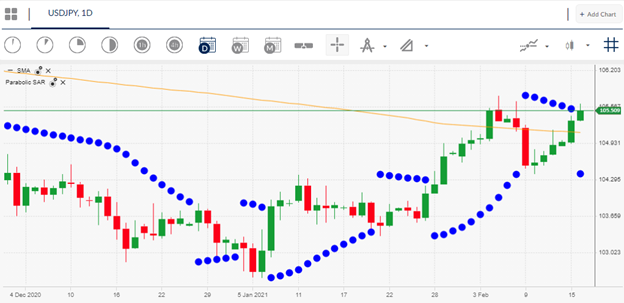
The US dollar is testing towards its 200-day moving average against the Japanese yen currency, following recent comments from the Bank of Japan surrounding a new policy assessment in March and potential ratcheting up of QE.
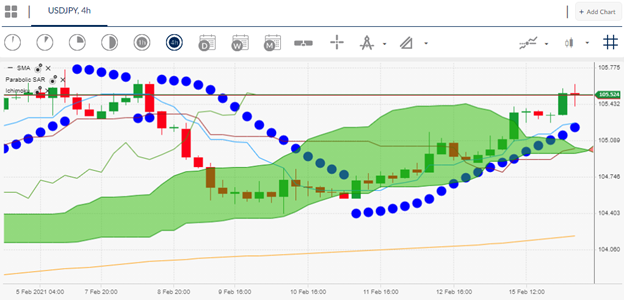
Last week’s recovery from the 104.40 level is looking increasingly impressive. It certainly suggests that the ongoing upmove above the 105.00 handle has legs, and dips are now for buying, in expectation of further strong gains to come.
Traders and investors are clearly speculating that the Japanese central bank could follow through in March and increase QE purchases. One thing if for sure, the current threat of further policy action is giving the USDJPY pair a lift.
Weakness in the Japanese yen currency is highly attractive to the Bank of Japan and the Japanese economy, due to the fact that Japan has a strong manufacturing economy, which is heavily focused on electronics and automobile exports.
Going back to the 200-day moving average, this is a key benchmark level that traders need to overcome to cement further gains towards the 106.00 area. From a technical perspective the 200-day moving average is used a key metric to define a bullish or bearish trend.
Continued gains above the 200-day moving average, which is currently located around 105.35, will encourage technical traders to buy into the ongoing recovery. Multi-day price stabilization above the 200-day moving average is almost certainly required, given the length of the bear trend in the USDJPY pair.
The next Bank of Japan policy meeting is scheduled for the March 18th, meaning that the USDJPY pair still has plenty of time to benefit from more buy the rumour mania from traders expecting the central bank to act.


