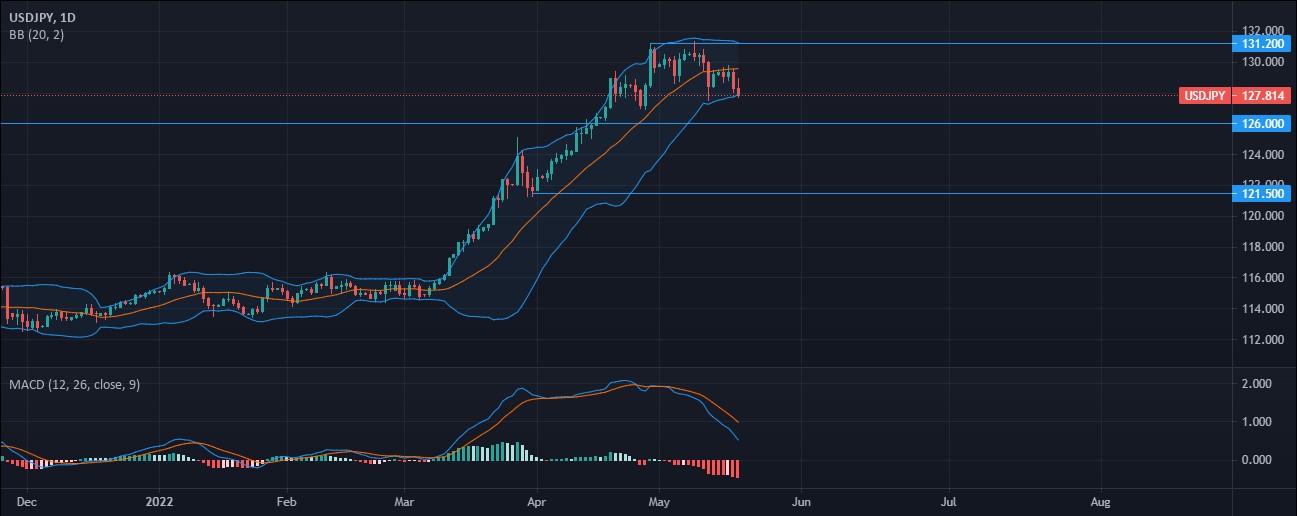
The USDJPY extended losses by -0.25% towards the 126.00 area ahead of the US Jobs data and Existing Home Sales. The pair is currently in a midterm correction phase as investors await the inflation data from Japan early Friday morning. The positive fundamentals surrounding the Japanese yen have seen a stronger Yen this week. Japanese GDP data released on Wednesday has signalled economic recovery despite maintaining negative interest rates.
However, the hawkish remarks from the Fed have seen the Dollar remain resilient in the near term. Fed Chairman Jerome Powell indicated the Fed is committed to raising rates by 50bps at the next two policy meetings in a bid to achieve price stability.
Traders shift their focus to US Jobless Claims later in the New York session and Japanese Inflation data early Friday morning.
See real-time quotes provided by our partner.
The USDJPY bulls lost steam at the 131.20 area as the pair experience extremely overbought conditions. The stochastic RSI indicator reading is above 80.00, indicating the possibility of a midterm correction. USDJPY rallied for 2 consecutive months breaching above the 126.00 high. There is a possibility to see a retest of the 126.00 previous resistance turned support before a rally towards the 135.00, a 24-year high.
A failure to hold above the 126.00 may cause further downside pressure towards the 120.00 psychological support which coincides with a Williams Alligator indicator.
Retail Traders are increasingly bearish on the USDJPY pair ahead of the Japanese Inflation data. 74% of the retail traders are short on the pair as traders price in on a positive Inflation data. The Japanese GDP data released on Wednesday morning beat expectations by far and traders could use those figures to price in a positive Consumer Price Index data.
See real-time quotes provided by our partner.
USDJPY has a bearish outlook in the short term and critical areas to watch out for are the 127.00 support and the 129.00 resistance. A break below the 127.00 immediate support may renew selling pressure towards the 126.00 previous resistance turned support. Upside gains are capped by the 129.00 resistance coinciding with the Bollinger Band (20) baseline and a break above that area may see bulls targeting the 131.20 resistance.
The MACD indicator shows the pair is bearish in the near term as indicated by volume bars dropping below the 0.000 benchmark. The MACD moving averages are still in the positive region giving bulls optimism if the 126.00 handle holds. However, a crossover below the 0.000 mark may reinforce a bearish outlook in the near term. Bears may possibly target the 121.500 support.