The GBPNZD traded lower by -0.30% ahead of the Friday New Zealand trade balance data YoY (April) 2022. The pair is currently at a critical pivot at 1.9650 as investors wait for a long-term market direction. GBPNZD remains under selling pressure amidst rising inflationary pressure to a 40-year high. The BoE is expected to hike rates by 25bps at its next policy meeting although investors remain worried about the falling consumer spending.
The New Zealand PPI for the first quarter of 2022 surged higher for both the PPI input and PPI output. Investors pay attention to the Trade balance data release on Friday ahead of the 25 May monetary policy meeting.
Chinese easing of lockdown restrictions may boost investor sentiment on commodity demand.
See real-time quotes provided by our partner.
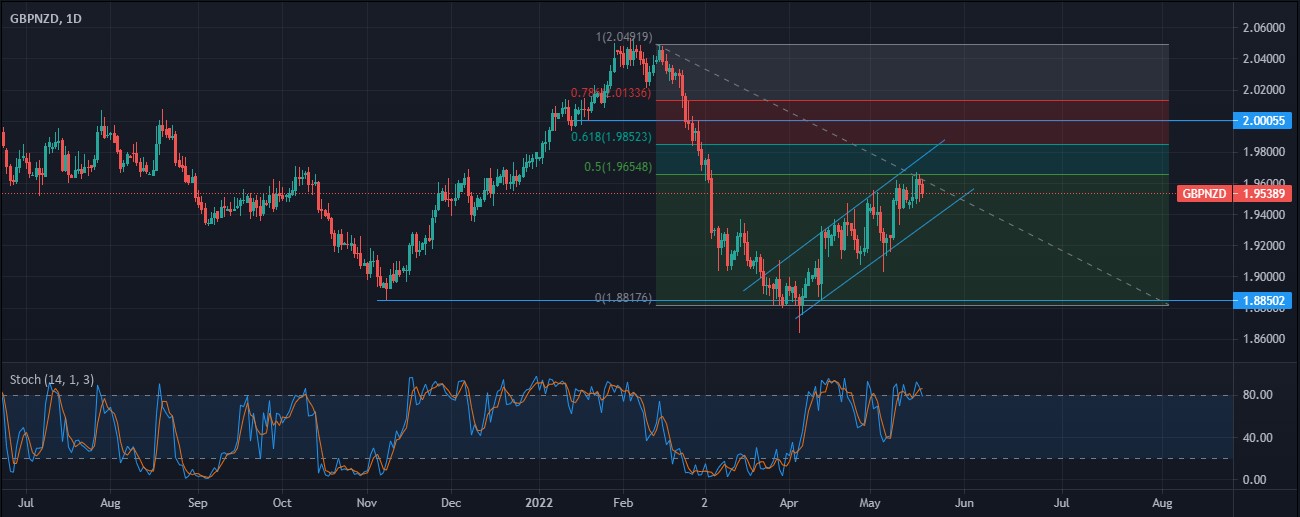
The GBPNZD has reached a critical pivot point as bulls managed to correct 50% of the recent plunge from February 1 to April 1. A Fibonacci Retracement Tool is used by professional traders to gauge the depth of a price retracement point and traders should watch these critical zones used as resistance areas; 50% at 1.9600, 61.8% at 1.9650 and 78.9% at 2.01551.
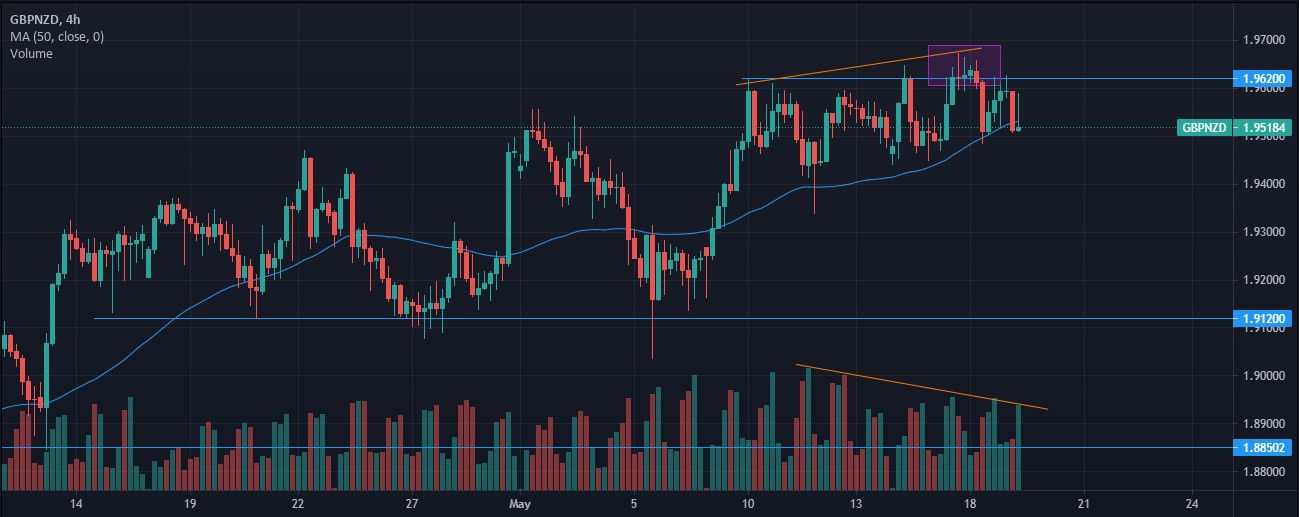
This corrective pattern can clearly be displayed by the rising channel towards the 2.000 psychological figure. A failure to break the 1.9600 may push the pair lower towards the channel’s lower trendline. A confirmed break below that area may renew sellers’ interests in targeting the 1.88000, 14 months low.
The Stochastic oscillator reading is above 80.00 showing that the pair is extremely overbought and a failure to challenge the 1.9600, 2 months resistance may see the pair trading lower in the near term.
However, a break above the 2.000 mark may invalidate the bearish outlook and bulls may target the 2.050 resistance, a February 2022 high.
The ActivTrader Sentiment indicator shows that 53% of retail traders are currently bearish on the GBPNZD. Traders need to look for a breach of the above zones while on the sidelines. The energy crisis in Europe has seen the UK’s inflation rising to a 40- year high as Ukraine/ Russia war continues to fuel supply disruption. A rise in commodity prices will act as a tailwind for the New Zealand Dollar.
See real-time quotes provided by our partner.
The price action of GBPNZD is quite choppy on the 4-hour chart as the pair remains rangebound. GBPNZD is capped by an immediate resistance at 1.9650 and a 1.9500 support, coinciding with a 50-day moving average. The pair has a divergence between progressive higher highs and falling volume bars. This indicates that despite the bullish attempt to push prices higher, there is not enough volume to cause a breakout above the 1.9650 resistance.
On the bearish side, the chart shows reversal candlesticks patterns at the 1.9550 resistance and a break below the 1.9500 support may reinforce a bearish outlook towards the 1.91200, a 6-weeks low.