Forex Analysis
There are indications that the Japanese yen may be bottoming out and in an accumulation phase, which could cause the USDJPY and other yen crosses to fall. Additionally, the Australian data have been good recently, and the Reserve Bank of Australia has signalled that they are tightening monetary policy, which could also boost the Australian dollar. But if global demand for commodities were to dimmish due to things like Chinese COVID lockdowns, the Aussie would fall hard. Since the FOMC and other central bank decisions around rate hikes etc., there have been many forex moves based on geopolitical and global macro sentiment. The AUDJPY is a forex proxy to risk sentiment and therefore a key leading indicator that can support the recent moves seen in the equity space or signal a divergence.
See real-time quotes provided by our partner.
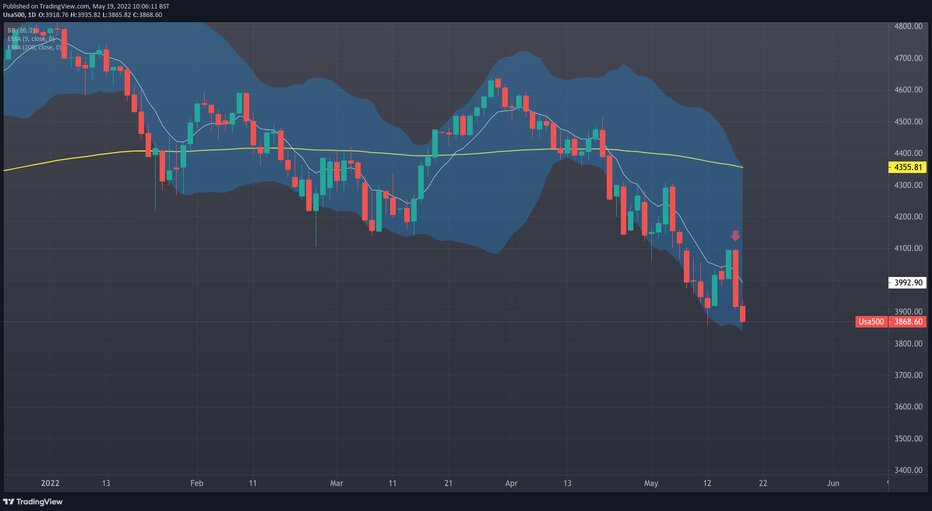
As global equity markets came back under renewed selling pressures over the last few trading sessions, the tentative improvement in investor sentiment at the start of the week, proved to be short-lived. It was the US equity market and particularly the S&P500 and the NASDAQ that suffered the greatest losses. They have lost the gains recorded in the previous four trading sessions & yesterday’s drop in the S&P 500 was the biggest daily sell-off seen since June 2020.
Over the past year, CTAs have represented a large share of the market participants, and with rules-based, algorithmic trading strategies, they have become the clear winners, as they are those who shorted bonds and equities and remained long commodities and the dollar. Recent data indicates their signals are now reversing as other investors shift their positions to the “contractionary” side of the economic cycle. It is now a battle of those that buy at the lows and sell at the highs, versus, those that sell at the lows to buy lower.


The USDJPY correlation with the 10yr UST remains tight. USDJPY is likely to remain neutral over the week, but a run-up to 135 and then 150 remains on the cards whilst we’re technically in a bull trend and should short sellers be trapped, and more selling occur in US fixed income before the next FOMC meeting. As the USDJPY is the major cross, the AUDJPY will follow its lead.
See real-time quotes provided by our partner.
The daily chart for the AUDJPY gave a technical signal to go long this week at the close on Tuesday. Currently that position would be underwater as the AUDJPY continues to correct the previous impulsive move. If the AUDJPY were to stop traders out with a sweep of last week’s lows, there is still the daily 200-period ema which is resting at the 61.8% Fib level to act as support and possible provide a buy signal.
The fact that the AUDJPY bounced previously off the 50% level and signalled a buy, gives me hope that this signal has merit, and we get a decent continuation higher. The previous buy signal came at the end of April but the 94.00 level proved to be where the sell orders overwhelmed the late comers to the bull trend. Therefore, getting above that swing high from the 5th of May is my target.