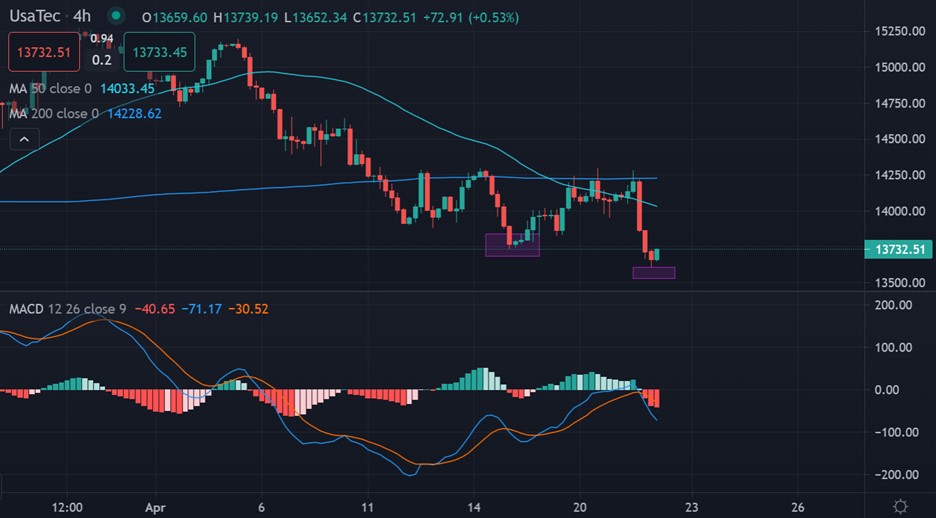
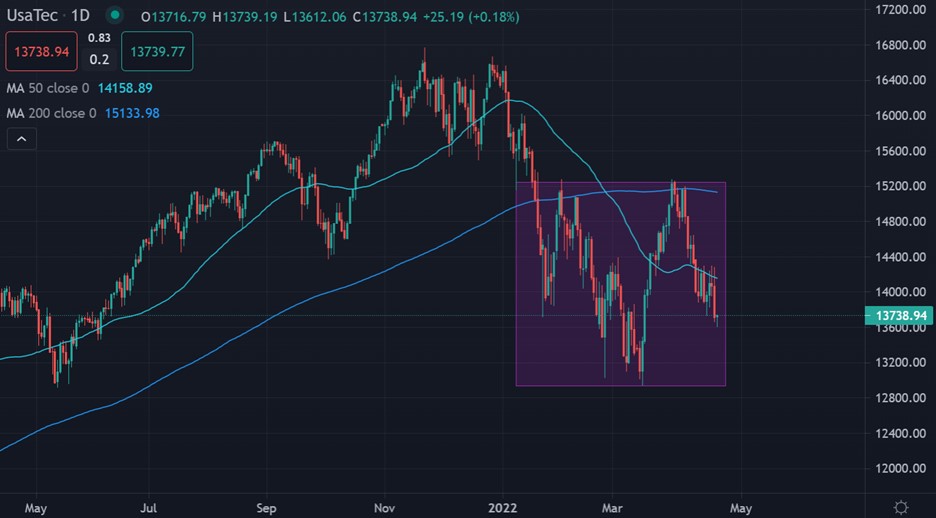
The Nasdaq has crashed towards the 13,700 level after Federal Reserve Chair talked up the need for quicker rate hikes in the coming months, while a host of other Fed members reaffirmed their hawkish bias.
Bonds yields spikes, stocks crashed, the US dollar pump as Chair Powell said the Fed must move faster than it has in the past to rein in high inflation, as CPI moved above 8% in March, while PPI crept above 10%.
Chair Jerome Powell basically signalled that sharp interest rate increases are likely in the coming months, beginning at the Fed’s next policy meeting in May. The larger-than-average 50 basis-point interest rate hike is all but price in.
Going forward, the Nasdaq has scope to bounce from the 13,700 level, because there is near-term bullish price divergence extended to 14,000 that needs to be eroded. Additionally, bullish patterns are building.
However, should the Nasdaq remain below the 13,800 level then the chances of a sharper decline down towards the 12,500 level is also possible. In short, it is very important that the Nasdaq regains the 13,800 level over the coming weeks.
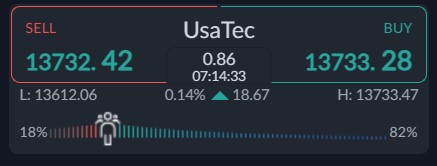
The ActivTrader market sentiment tool is showing that some 82 percent of traders are bullish towards the US dollar index, which is an increase of around 7 percent since last week.
The fact that sentiment is still very bullish is worrying for more losses. Especially since the price collapse. I would prefer the herd to flip to negative before I think we see a meaningful price bottom forming for the Nasdaq.


