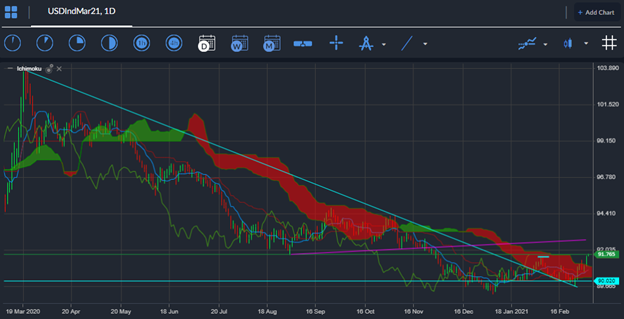
After months of sideways trading action, a major range breakout has taken place in the US dollar index. Federal Reserve Chair Jerome Powell’s lack of concern about the state of the US bond market was the straw that broke the camel’s back.
The bullish case for US dollar index is set against a backdrop of rising hopes that the US economy is going to recover soon-than-expected, and that signals from the bond market bode well for a recovery in the US dollar index this year as well.
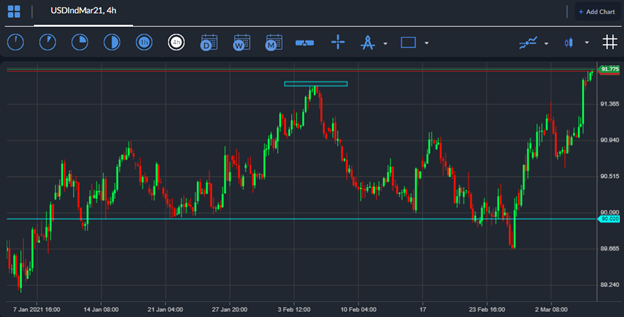
With the US Dollar Index finally staging the much-awaited upside breakout a powerful short-term trend could start to develop. With the US dollar index targeting big levels like the 92.00 and 93.00 resistance levels.
So far, the comeback story for the greenback has been one of disappoint up until yesterday. The lack of follow through has traders concerned that the recent move could reverse at any time. More traders may be waiting for the release of today’s Non-farm payrolls job report before pilling into a new short-term trend.
Additionally, those traders that are concerned about a false breakout have some good reason to be fearful. The Biden administration rolling out its massive stimulus plan could cause a reversal of weakness for the buck. Additionally, any unexpected activity in the US bond from the FED could cause some US dollar selling.
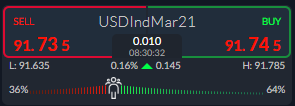
Looking at how traders are currently positioned, it is a clear case of bullish optimism. The ActivTrader platform market sentiment tool shows that some 64 percent of traders are becoming overly bullish towards the US dollar index right now.
The one-way sentiment skew is not that bad at the moment, which could hint at more short-term gains ahead. A degree of caution is advised here, as the US dollar index has been stuck in a range of 90.00 to 91.50 for some time now. A multi-week higher time frame close from either side of the mentioned range s probably needed for clear technical confirmation.


