The FTSE100 had a torrid week last week as stock markets crashed globally due to fears about the Chinese economy slowing and that inflation in the United States is still out of control.
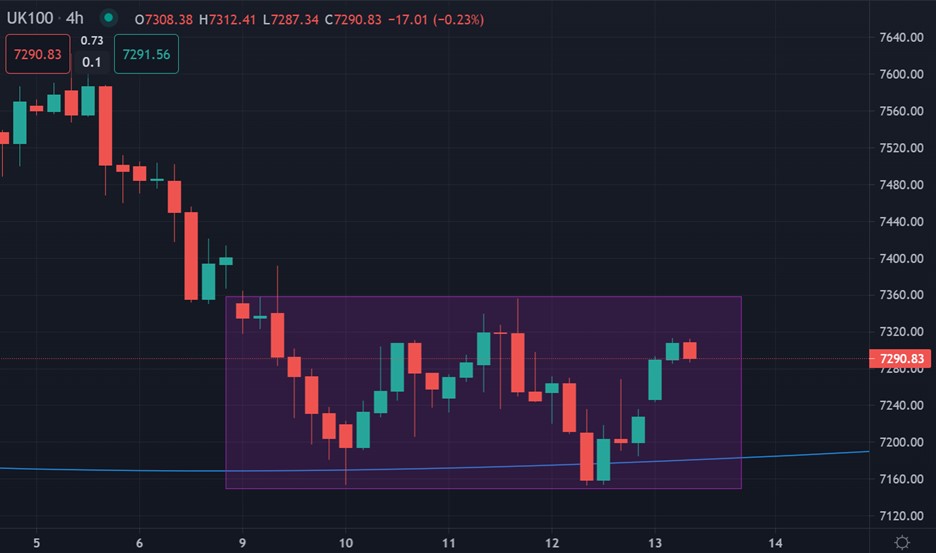
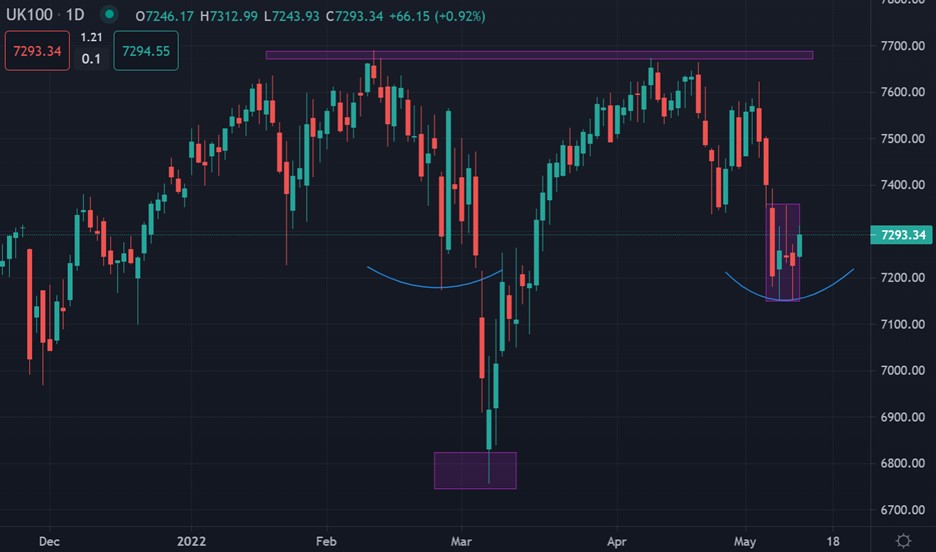
Most of the recent gains in the UK100 were wiped-out, however, the technical for the FTSE100 are by no means terrible, given that the leading UK index still has strong year to date gains.
Data last week showed that the UK economy contracted by 0.1% in March, as surging inflation took a toll on demand to offset the boost that had been expected from the end of COVID restrictions.
The monthly figure compares to no growth in February and 0.7% growth in January, while the quarterly figure (between January and March) showed a growth of 0.8%, which was down from 1.3% in the previous three months.
The UK’s short-lived impact from Omicron meant the economy grew 0.8% in the first quarter, but almost all this growth came in January.
Output slipped 0.1% in March and economists are forecasting a second decline in April due to the ending of free Covid-19 testing.
Health spending has been a key driver of GDP through the pandemic, as other sectors continued to lag. Given inflation and growth risks, markets currently expect another five hikes in interest rates by next spring.
It should be noted that the extremely weak British pound could give the manufacturing sector a boost, however, this is really on against the US dollar, although the pound is quite weak against the euro historically.
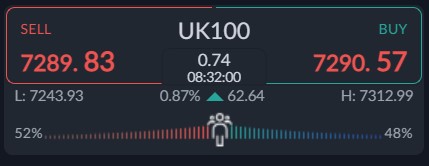
Sentiment towards the UK100 is also bearish right now. According to the ActivTrader platform over 52 percent of traders are bearish towards the UK100. This is a drop since last week.
Typically, the retail crowd is on the wrong side of the trade more often than not, so the UK100 could continue to rise this week and month, which the price action and chart certainly suggests is possible.


