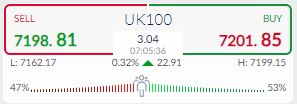
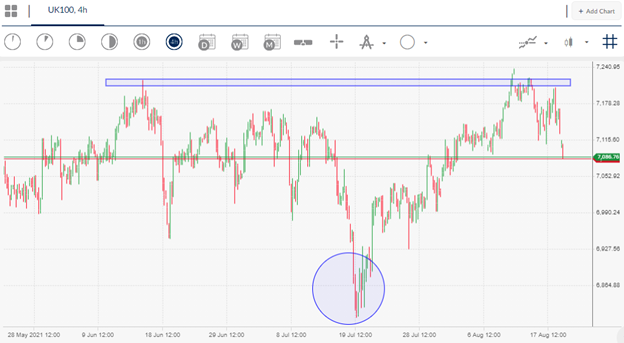
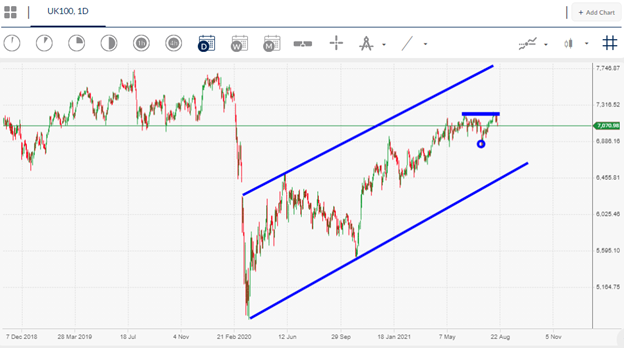
The FTSE 100 continues to hold firm around the 7,200 and enjoy strong dip-buying, despite other European and global equity markets tumbling over Chinese COVID-19 and growth concerns.
Typically, the leading UK index has a strong correlation with US and European indices, however, the better-than-expected UK data and a rise in mining stocks helped the FTSE100 actually closer higher.
Expectations of a post-lockdown slump in unemployment claimants failed to materialise in the UK job report this week, while UK wages and the official unemployment rate improved.
A sharp decline in the British pound currency also helped boost the FTSE100. Typically, sterling weakness is bullish for the index, while strength is negative, meaning the index and sterling usually have a confirmed inverse relationship.
Traders also shrugged-off the news that BHP Group, a mining giant inside the FTSE100, was set to leave the index after two decades. These ramifications are could yet to be felt, this is a story worth monitoring in future.
Mining stocks one of the largest sectors on the index, and the exit of BHP from the FTSE 100 could be a shift away from the commodity focus, which has been dominant over the years.
Sentiment towards the UK100 is not matching the current bullish bias and how traders appear to be growing in confidence. According to the ActivTrader platform some 53 percent of traders are bullish towards the UK100 right now, while 47 percent of traders are bearish. It is hard to gather much from sentiment at the moment.


