The British pound has been struggling to hold onto gains over recent weeks against the US dollar as any upside rallies have quickly fizzled out in the face of a more uncertain global economic backdrop.
Retail sales and CPI inflation data from the United Kingdom economy and risk-off trading sentiment in broader financial markets are likely to be key focuses for sterling traders this week.
The GBPUSD pair has had a strong correlation with the S&P 500 over recent years and tends to perform poorly when this index is starting to slide. Monday and Tuesday of this week were classic case studies of this dynamics.
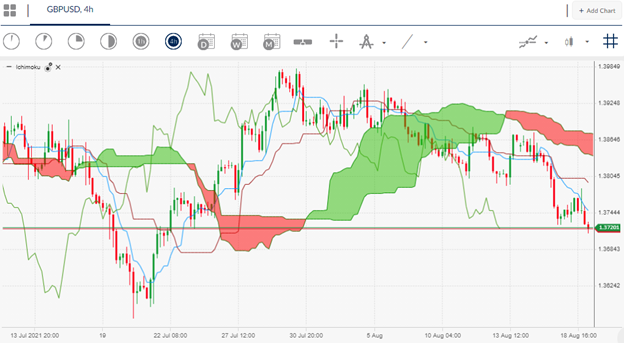
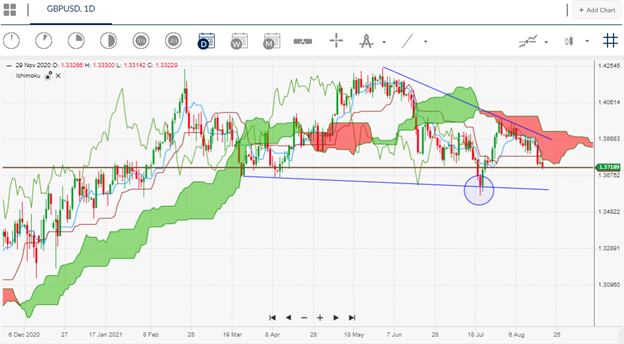
With sterling under pressure it is also time to look at the short-term and also the longer-term price trend. Technical analysis shows that the short-term trend is bearish below the 1.3850 level, while the over trend is only bearish below the 1.3770 level, which is the location of the pair’s 200-day moving average.
Should we see the overall trend turn bearish then the GBPUSD pair could slip towards the 1.3670 level, and possibly the former monthly trading low. If the short-term trend turns bullish alongside the current long-term bullish trend then I suspect we could see another challenge towards the 1.4000 level.
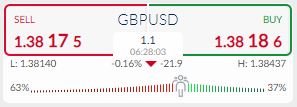
According to the ActivTrader Market Sentiment tool some 63 percent of traders now have a bearish bias towards the GBUSD pair. The bearish sentiment skew is mildly bullish as we do usually look to trade in the opposite direction of the retail crowd when looking for sentiment trades.


