Tesla’s stock price fell beneath its IPO opening price on the S&P 500 yesterday and turned negative on a yearly basis as US stock markets started to unravel, following yet another down day for technology and so-called lockdown friendly stocks.
The ongoing decline in Bitcoin also appears to be hurting the fortunes of Tesla, as the fate of the world’s largest digital asset and the world’s largest electric automobile maker are now appear increasingly correlated.
Elon Musk also lost the title of the world’s richest man as Tesla’s stock price plunged close to the benchmark $600.00 support level. Reports suggest that Musk lost close to $15 billion as Tesla’s stock price took a double-digit hit.
Looking at Bitcoin, it appears that the top crypto could be headed much lower over the coming weeks, as it is starting to look frothy, following months of rapid appreciation, and triple digit gains on the crypto market.
Should we start to see a severe correction in Bitcoin it could certainly harm Tesla’s stock price, due to the $1.5 billion investment that the company made in the cryptocurrency. Reports also suggest that Tesla paid an average of around $37,000 for Bitcoin. This makes the buy-in price a natural target for speculators and an area whales may defend.
Tesla could also take a further hit as tech stocks do not look like they have found a meaningful price floor yet. With the reflation trade coming back into favour, and the US recovery story building traction, the once loved tech-sector could well come under further pressure.
Even another dovish speech from Federal Reserve Chair Jerome Powell before US Congress on Tuesday failed to lift financial markets. It seems that change in thinking is currently undergoing the mind of investors. This could hurt Tesla over the coming days and weeks.
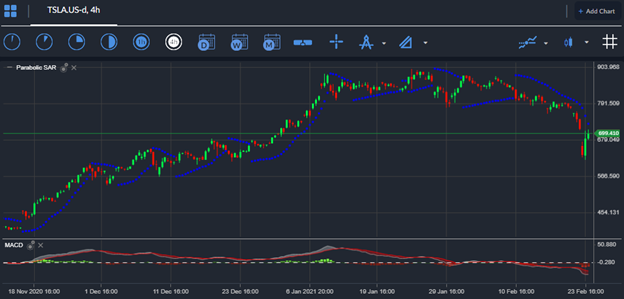
Tesla Short-term Technical Analysis
The four-hour time frame shows that Tesla’s stock price has notable bearish MACD price divergence extending down towards the $500.00 level. This means that more double-digit losses could be coming Tesla’s way.


