Nasdaq Weekly Analysis
The regular trading hours today started very much like the London open in the Globex session. With the initial move being a sell off towards yesterday’s lows. There is a feeling that the house of cards that the Nasdaq is built on, doesn’t have very good foundations. The run up to this last 7 days of sideways action was on low volume and price melted up with large day ranges and small consolidations. Should we get below the 15550 level the levels of support are few and far between, with several open gaps in price from the open, occurring on multiple days before at low prices.
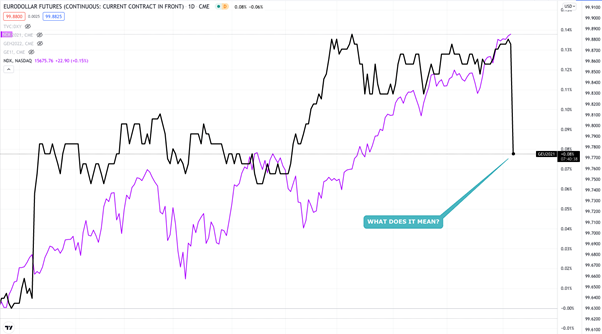
It may be a coincidence, but I happened to be looking at the Eurodollar futures just before the US open when the continuous contract suddenly dropped like a rock. Yesterday I was talking about how I was worried about a contagion of bad credit coming over from China. Today we learned that Treasury Secretary Yellen sent a letter to the US House of Representatives. In the letter it states that:
After the debt limit was reinstated on August 1, Treasury began employing certain extraordinary measures to continue to finance the government on a temporary basis. These measures, which are authorized by law and have been used in previous debt limit impasses, include a suspension of certain investments in the Civil Service Retirement and Disability Fund, the Postal Service Retiree Health Benefits Fund, and the Government Securities Investment Fund of the Federal Employees’ Retirement System Thrift Savings Plan. Once all available measures and cash on hand are fully exhausted, the United States of America would be unable to meet its obligations for the first time in our history.
This means that within the next couple of months the US may default on its liabilities. There is no reason for it to do so as the debt ceiling is a political gesture to supposedly keep spending under control.
See real-time quotes provided by our partner.
The Nasdaq moves fast, and it is hard to keep up with it and write, so I will just describe the price action up until the time of writing. As price arrived at the Globex lows there was enough demand to halt the waterfalling that had occurred straight off the opening bell as traders digested the possibilities of a default. The m5 candles show a couple of bullish engulfing candles and these were the buyers defending the day’s lows. My thoughts on why they would want to do that are:
- We’re in a long uptrend and buying the lows is usually a good idea.
- They wanted to get short nearer the US open and reverse their position.
Turns out it was idea 2.
There is no reason for the US Treasury to default and we have seen the US government shutdown in the past. It is not the end of the world, but it is politically damaging and something President Biden won’t want on his watch. So, assuming that traders are using this “Bad News” to get a better entry, the question becomes where are everyone’s stops?
See real-time quotes provided by our partner.
I always mark-up double bottom chart patterns as I believe retail traders see this as a sign of support and place their stops there. As you can see from the chart above there were a couple of double bottoms formed in the last week of trading and in today’s price action in relation to yesterday’s low. The nearest doble bottom offered no support, so my attention turns to the area further away that formed at the beginning of Septembers trading.
See real-time quotes provided by our partner.
Now that the stops have been run those that are long have a couple of choices to make. Hold on for new all-time highs and the 16,000 level at least. Or cash out at the old support levels which now become resistance.
See real-time quotes provided by our partner.
The trend at the start of the day and at the time of writing is to the upside with the daily 20, 50 and 200 exponential moving averages all pointing higher. Momentum is on the side of the bulls. Daily price action is on the side of the bulls too, as major support is a long way below around 15,200 with a couple of balance areas in-between where we are and the blue horizontal line on the chart. The circle on the daily chart is the June FOMC meeting to highlight that the Nasdaq traders have not been concerned with possible rate hikes, appreciating US dollar prices or possible tapering. They may start to consider that in the future, but the point is that they haven’t noticed a lot of the market commentary around the Fed for a couple of months now.
The net fiscal flows from the US Treasury have been elevated and are currently coming in each month around $600billion, which is 50% more than pre-pandemic levels and look likely to be net higher than the actual pandemic response. This money flowing into the US economy will find the Nasdaq traders as it has the S&P500, Dow Jones Industrial Average etc. If the debt ceiling is capped but fiscal spending remains elevated the indices should not falter. If the debt ceiling is capped or reduced and spending comes back down towards $400billion, the indices have a long way back towards the pre-pandemic levels. Why would the fall? Firstly, there would be less money in the system than there is now. Secondly, corporate profits would suffer and any slight miss across most of the corporates would be enough to topple the markets. Whether the Eurodollar futures give us a clue to which way everything is heading remains to be seen, but I will keep my eye on them and include it in my analysis when I work out any relationships developing.