Gold closed the week slightly under its 200-day moving average last week as the yellow metal came under pressure after the FOMC meeting and reversed from the $1,800 resistance zone.
The US Federal Reserve hiked rates for a consecutive meeting last week, and market players are now starting to factor rate hikes for longer after getting ahead of themselves with the FED pivot.
Gold is also falling as the US dollar is starting to rise. This has been hugely impactful on the price of gold this year, with the US dollar sharing a strong inverse relationship with the gold.
Going forward we could be about to see a classic buy the dip scenario take place, where gold becomes a very attractive buy around the mid $17,000s this week.
Technically, golds run above its 200-day moving average is a positive sign. It is imperative that the yellow metals continue to make traction above this key technical metric this week as well.
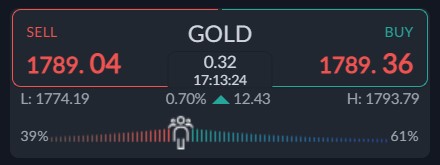
Current sentiment metric towards gold shows that sentiment has become slightly more bullish, which hints that retail are leaning towards more gains this week.
The ActivTrader market sentiment tool shows that 61 percent of traders are bullish towards gold. Going forward, we really need to see a negative bias by retail or more losses are likely.
This is one of the reasons also why I think the price of gold could be due to fall again this week alongside bearish technical signs which I will discuss below.
Gold short-term Technical Analysis
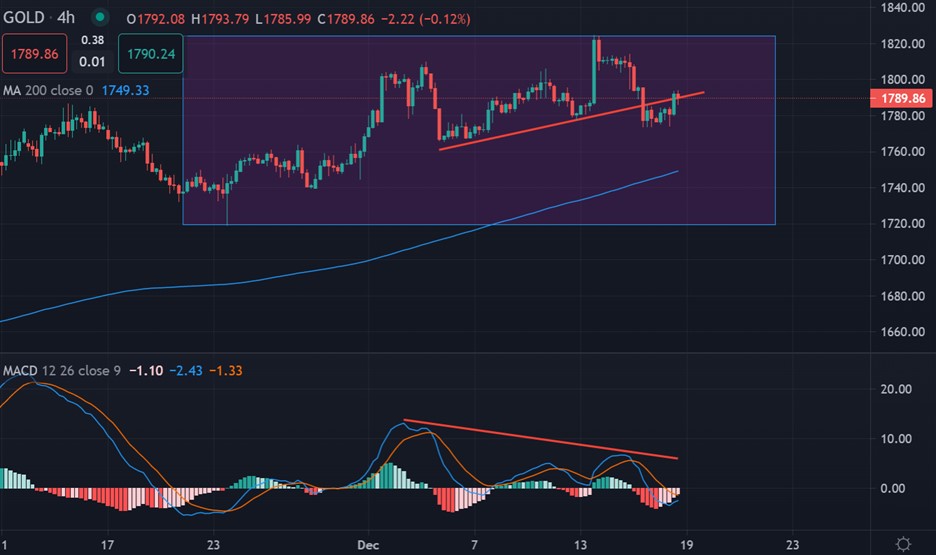
According to technical analysis gold the price of gold has formed a head and shoulders pattern on the four-hour time frame after reaching the $1,820 level.
These type of pattern invalidations are usually very bearish. It is also noteworthy that negative price divergence on the MACD indicator is seen down towards the $1,750 support level.
See real-time quotes provided by our partner.
Gold Medium-term Technical Analysis
The daily chart shows that the yellow-metal has moved back inside its two-year range and more importantly it is starting to make traction above its 200-day moving average for the first time in nearly 6 months.
We could see the price of gold revisit the top of its range again around $1,875. However, before that the price of gold may correct lower as a large, inverted head and shoulder pattern looks to be forming.
See real-time quotes provided by our partner.