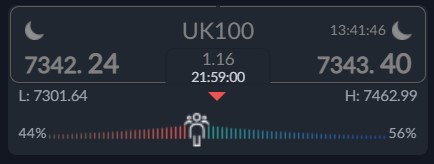
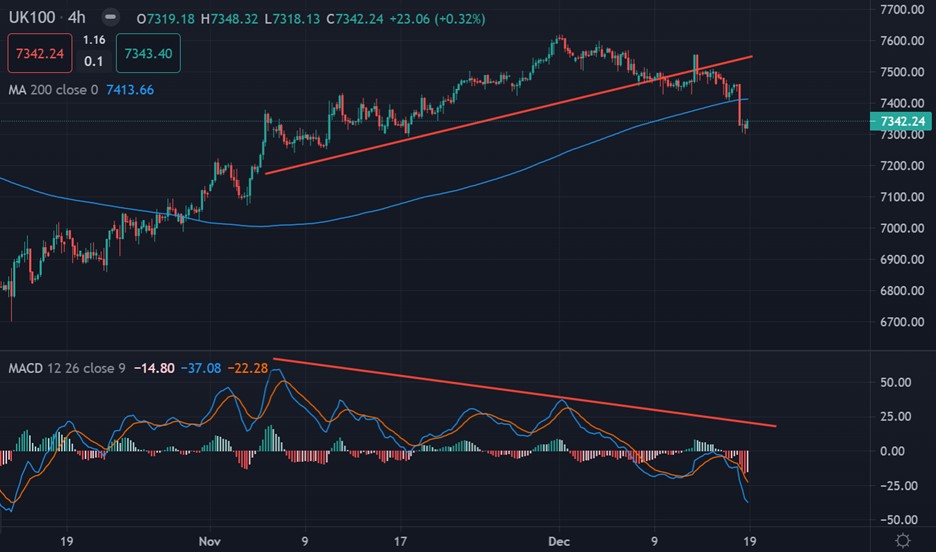
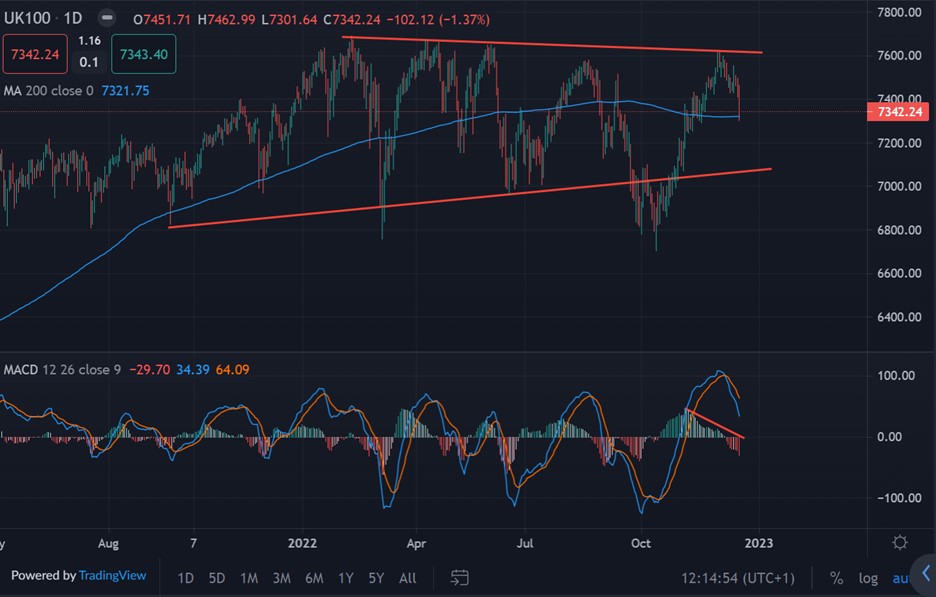
The FTSE100 had a very bad week last week as global indices turned sharply lower as central banks across the globe continue to suggest that more rate hikes are coming in 2023.
On the week, the UK100 closed under its 200-day moving average, setting up a bearish week ahead of the Christmas holiday. It is highly likely more downsides lay ahead during the month of January.
Investors face yet another interest rate hike as the Bank of England raised interest rates by 50 basis points on last Thursday, as widely expected. The central bank raised rates to 3.50% from 3.0% previously.
Six members backed the half a percent hike, while Swati Dhingra and Silvana Tenryro backed no change and Catherine Mann favoured a larger 75 basis point hike.
Market consensus is that more hikes are coming due to rampant price inflation and a potential energy and diesel shortage. Also, the UK economy still looks on shaky ground right now.
Looking forward, the monetary policy committee said that there are ‘considerable’ uncertainties around the UK’s outlook and confirmed that it will respond as ‘forcefully, as necessary’.
Sentiment remains slightly bullish, which could be a sign for further price losses ahead for the UK100. With retail looking to still we could see the FTSE100 falling towards the 7,000 level.
If we look at the ActivTrader Market Sentiment tool, 56 percent of traders are currently bullish. This metric has risen dramatically since last week. Based on the current sentiment reading I think it is highly probable that we could see the downside starting to accelerate.
UK100 Short-Term Technical Analysis
According to the four-hour time frame the UK100 has formed huge amount of negative MACD price divergence and is being reversed as the price continues to drop sharply.
The size of the negative divergence points to a pending drop towards the 7,200 area. I would suggest keeping a close watch on the 7,000 level also or incoming losses and a possible buying opportunity.
See real-time quotes provided by our partner.
UK100 Medium-Term Technical Analysis
The daily time frame shows that the UK100 is edging back towards the middle of its price range, and a move towards the 7,00 level would help form a huge inverse head and shoulders pattern.
If we see the UK100 starting to move towards the 7,200 to 7,000 area, then then it could be time to buy. Traders also need to keep their eye on a wedge pattern that has clearly formed.
See real-time quotes provided by our partner.