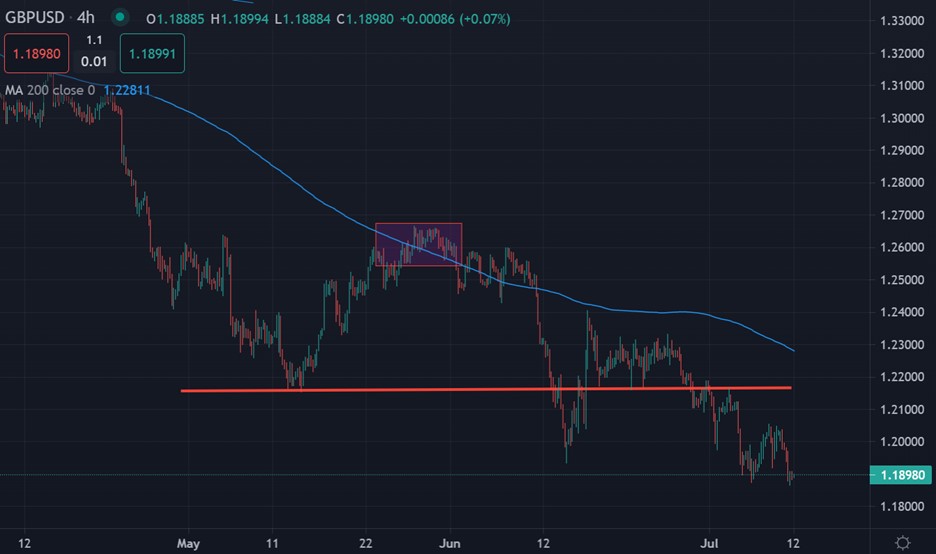
The British pound currency has fallen to a fresh yearly low against the US dollar as UK political uncertainty and an explosive early-week move in the US dollar index caused sterling to crack the 1.1900 level.
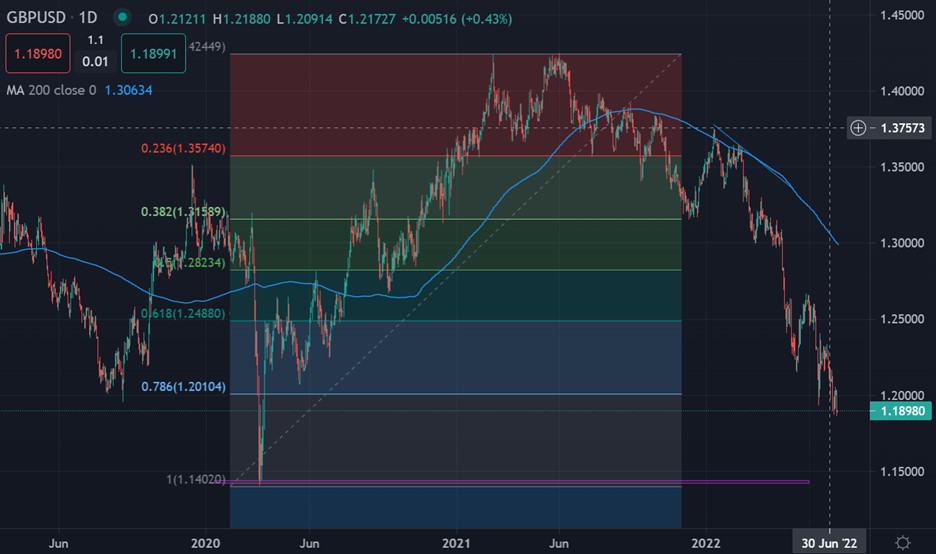
Traders are now looking towards the Brexit low in 2016, located close to the 1.1400 level as the next bearish target if the US dollar index heads towards the 110.00 resistance level.
Rabobank have put out an investment know about the pound suffering during this time due to a number of issues. The bank notes that “Although pound investors will be hoping for a government less distracted by scandal and more focussed on providing coherence around the post Brexit economy, the jury is still out”.
The note also said, “The pound may suffer a lack of fresh direction until the new prime minister is in place.” I tend to agree, and I think we could see a new range between the 1.1600 and 1.2000 levels this summer.
This week will see the UK’s latest monthly GDP figures released and these are expected to show no growth in May, reinforcing fears that second quarter data will show an economic contraction.
The UK economy contracted by 0.3% in April, according to official figures, following a small decline in March. The latest figures also showed that inflation reached a 40-year high of 9.1% in May, up from 9% in April.
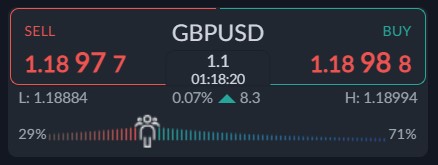
Looking at sentiment data and how traders feel about sterling, the ActivTrader Market Sentiment tool shows that traders are growing more bullish, despite the drop towards 1.1900 in sterling.
With 71% of traders are currently bullish, and it should be noted that this current sentiment reading is significant enough to be an extreme reading, as traders are now 3 to 1 long GBPUSD.


