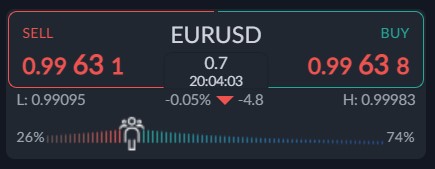
The EURUSD pair is breaking under parity again due to the European energy crisis placing pressure on the single currency. So far the 0.9900 level has held the decline.
Another break under the 0.9900 level could be the final straw for EURUSD bulls, as there is only very limited support for the EURUSD pair below the 0.9900 area.
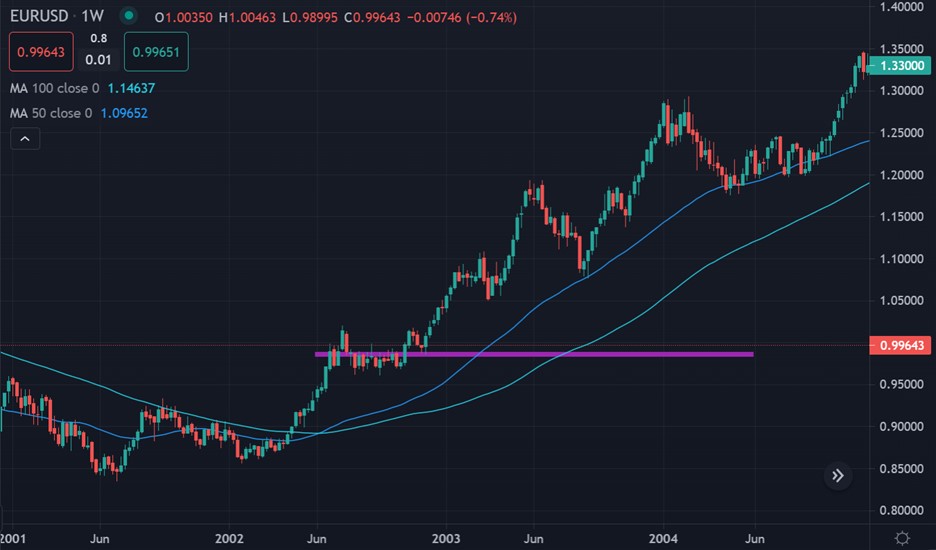
Worrying, long-term price charts really highlight that scale of the problem the EURUSD faces if the decline continue. A move below the 0.9860 area could spark a 360-point decline towards 0.9500.
This is because the long-term price charts show that the EURUSD pair has no meaningful resistance until the 0.9500 area if the 0.9860 support zone is broken.
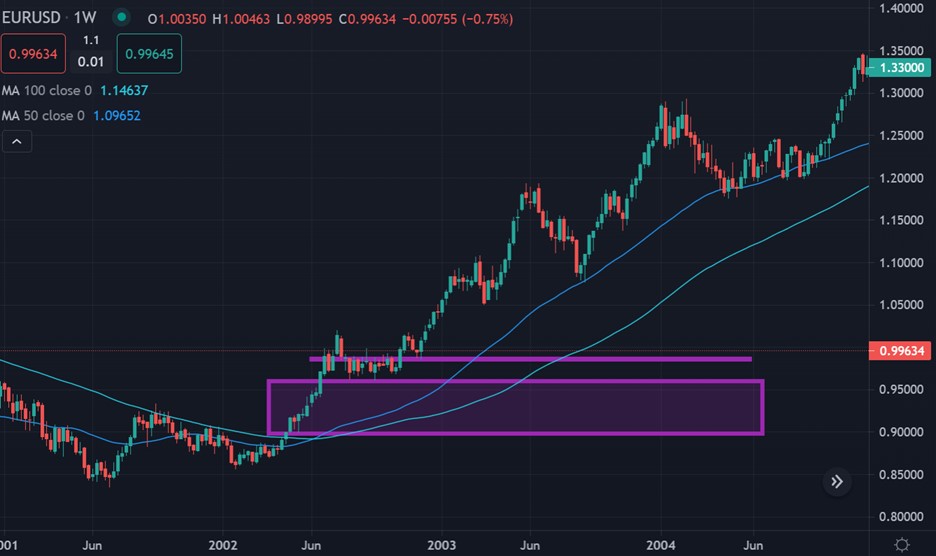
More worryingly, a move under the 0.9500 would be a disaster for the EURUSD pair and is only going to accelerate and pressure because no technical support exists until the 0.9000 level under the 0.9500 level.
Also, the ActivTrader Sentiment tool shows that 74% of traders are bullish on the EURUSD. This is very worrying if we consider that the sentiment bias is increasing each week on the long side.
As traders, we typically look to fade retail sentiment when it is overly skewed in one direction. This should be paramount in traders mind if the decline continues.
See real-time quotes provided by our partner.
The EURUSD weekly chart show that from December 2002 the next support zone for the EURUSD is seen at the 0.9860 level. We really have to go back in time to find this 19-year support.
Lower time frame analysis agrees and shows a bearish price pattern is now forming. This could actually take the EURUSD pair close to 0.9500 in the short-term.
See real-time quotes provided by our partner.
As seen by the daily weekly below, a massive price drop for the EURUSD over the medium-term could take place under the 0.9500 level as no support exists under this area.
This is actually projecting a move to the target of 0.9000. This is a 900 point plus drop from current levels.