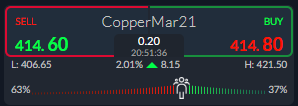
Copper broke above the $400.00 benchmark level on Monday, as the metal reached its highest level in nearly a decade as traders and investors continued to bet that supply tightness for the increasingly popular metal would increase as the world comes out of lockdown.
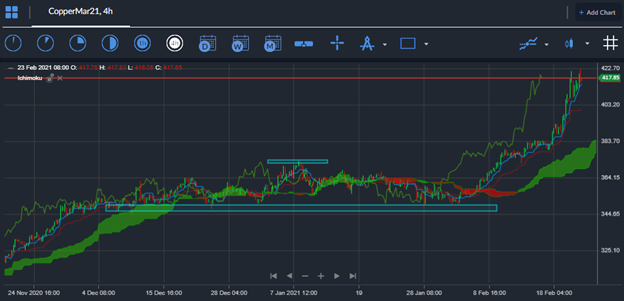
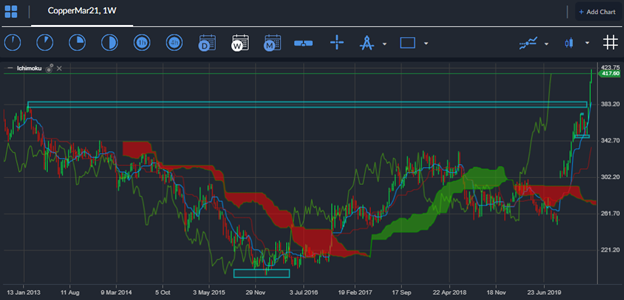
The price of copper had been threatening to break into a much higher trading range over recent weeks. A notable inverted head and shoulders pattern has been unfolding on the daily and weekly time frame as copper bulls continue to take out big technical levels.
Market participants have turned increasingly bullish towards commodities this month, with iron ore and oil posting massive gains on a yearly basis already as the so-called commodity supercycle goes into overdrive in 2021.
Copper has been rallying due to the belief that the bellwether industrial metal will benefit from increased demand once developed and emerging economies come out of lockdown, and fear of supply tightness in the physical market.
Another factor in play is the reflation trade. Following years of low inflation traders and investors are predicting that inflation will return due to the massive amount of government and central bank spending during the pandemic.
Financial markets are typically forward-looking, hence why copper is rising on the prospect of increased consumption and a return to some type of normality. Additionally, the Chinese economy is continuing to perform well and is widely tipped to remain the engine of growth for the world this year.
At the start of the week, the SHFE contract in China hit its upper trading band or daily limit as metals posted blockbuster gains. Silver more than recovered last week’s losses, and the price if tin rose to its highest level since 2011.
The ActivTrader Sentiment Tool is calling the current move higher in Copper. Usually, the best way to trade this great indicator is to look for one-way sentiment skews that are going in the opposite direction of price.


