The US dollar is trading at its weakest against the Canadian dollar in over a month as the US dollar index fell against a broad basket of major currencies and US equities shook off an early risk-off mood.
A familiar pattern has been happening over recent weeks, whereby we see risk-on moves at the start of the trading week, and then suddenly the market starts to quickly reverse.
Oil prices also climbed and Canadian bond yields have advanced further above their US counterparts, leaving the bias for the sell side. The gap between Canadian and US 10-year yields widened to 20 basis points, which worryingly market the widest spread since August 2012.
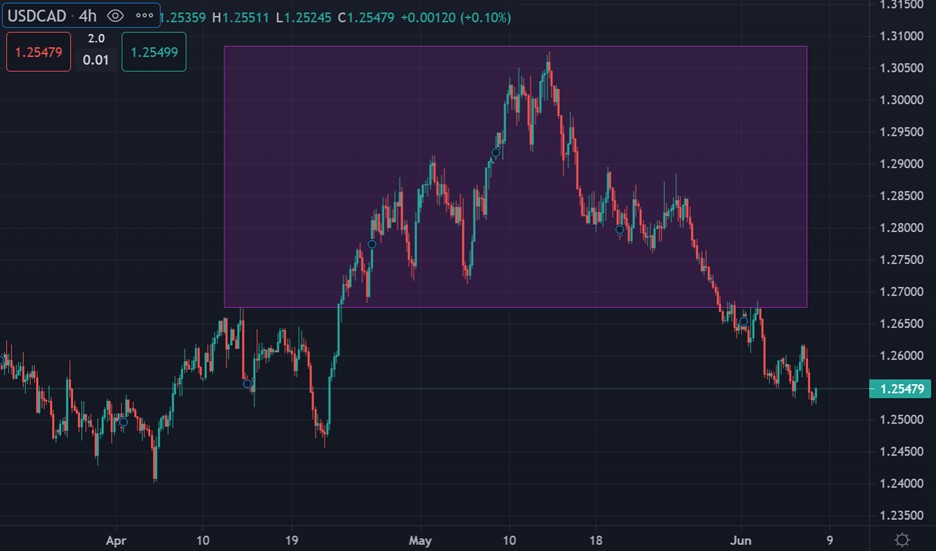
Traders looking to take advantage of this will likely look for opportunities to sell rallies in the USDCAD pair in the short-term. Last week’s Bank of Canada rate hike certainly bolstered the Canadian dollar.
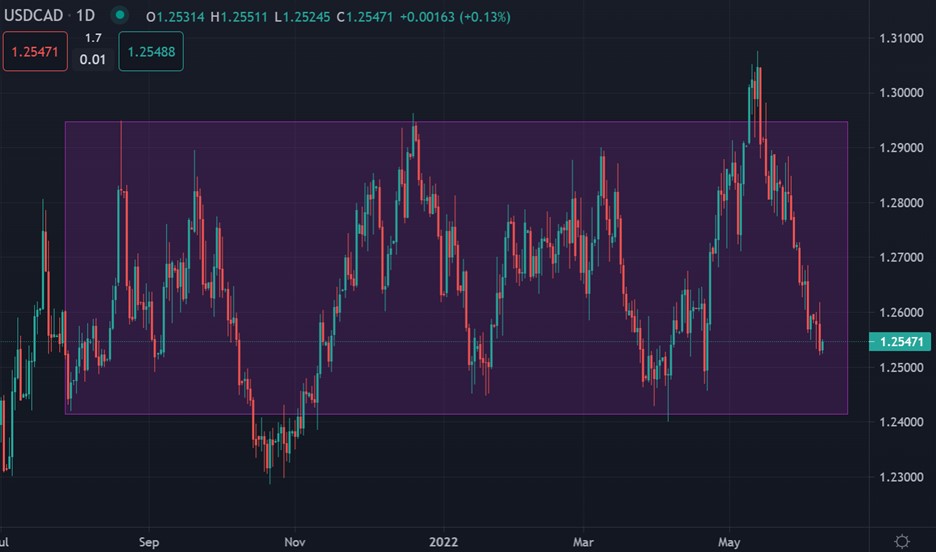
In the bigger picture we are seeing range bound trading. The USDCAD pair is caught in a large range between the 1.2400 to 1.3000. We could well see a challenge to the range low, ahead of the Fed, around 1.2400, over the coming days.
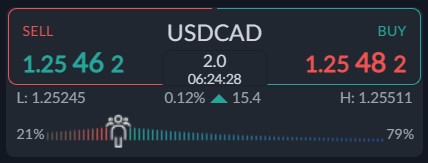
High levels of bullish sentiment are still being seen towards the USDCAD pair, with some 79 percent of traders currently holding a positive view towards the USDCAD pair.
This bullish sentiment bias is a big concern, and it could mean that USDCAD traders are in for a tough week again, and the expected move back towards the 1.2400 support level.


