The price of West Texas Intermediate oil has staged a strong pullback from the $63.00 resistance level as traders fear that the upcoming OPEC meeting could cause a strong downside correction, following four-months of straight gains for oil prices.
Oil has also started 2021 at a record pace, with the price of WTI putting in its best first quarter performance in over a decade. Calls for $70.00 oil continue to grow as the global economy shows signs of recovery, however, downside risks still remain.
Today, Saudi Arabia’s Prince Abdulzaziz bin Salman and Russian Deputy Prime Minister Novak meet via video-link to decide whether the recent spate of supply cuts will remain in place. The oil market has been alight with rumours that Saudi Arabia and Russia are going to disagree.
Market consensus currently suggest that Russia is keen for oil output to be restored to normal levels. However, both nations will be acutely aware that bringing oil back to full output could cause a downtick in oil prices.
Other forces are also at work, such as poor weather conditions and a boom in the commodities sector. Weather effects are likely to subside in March, however, signs of inflation in the US economy, and better-than-expected data is likely to be bullish for oil prices.
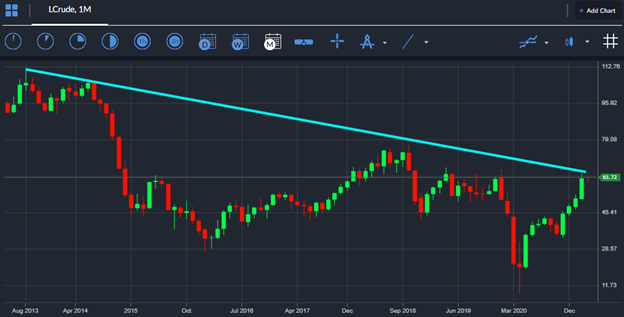
Something else to note is that a key multi-year trendline has been capping the advance in oil prices above the $60.00 level. This key monthly trendline has caused a series of major rejections and caused the recent downturn to $60.00.
Traders are likely to pay close attention this key monthly trendline, and a potential breakout or another technical rejection if WTI creeps back towards the $63.00 level.
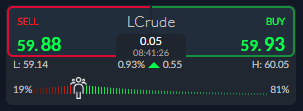
Market sentiment towards WTI oil remains very bullish, which is slightly worrying going into the OPEC meeting. The ActivTrader Market Sentiment tool shows that some 81 percent of traders are bullish towards further gains in Crude oil, meaning a large one-way skew is in place. Typically, this type of one-way bias ends badly, especially since oil has staged a $3.00 correction recently.


