The US dollar is testing towards the worst level of the year so far against the South African rand currency as the pair takes its cue from the recovery in gold price and overall weakness in the US dollar currency.
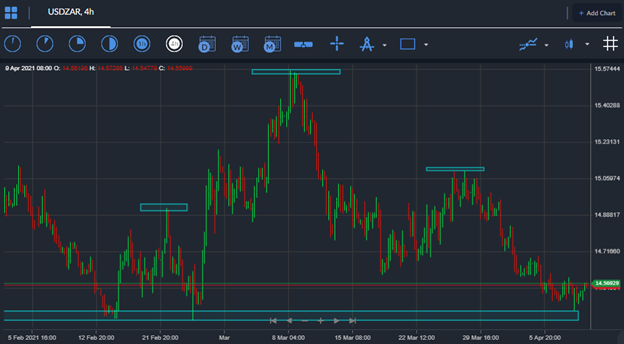
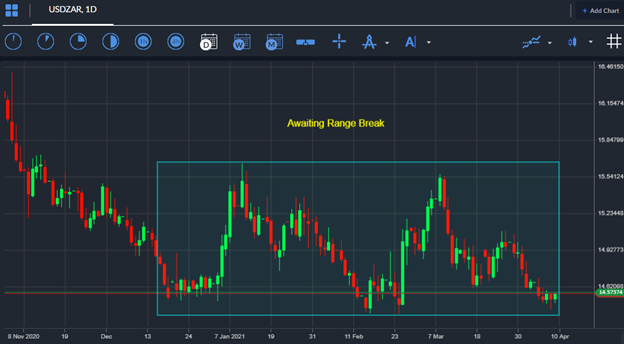
In simple terms, the USDZAR pair has been confined to a tight range this year, with the often fast moving currency pair trapped within the $14.40 to $15.60 price range. The pair is now testing towards the bottom of this range.
Risk-on sentiment and rising gold prices are key bullish drivers for the South African rand currency. The rand also appears to perform well when the South African stock market is rising or performing well.
South Africa has huge deposits of minerals and gold, so when the price of gold is rising listed mining companies in South Africa tend to perform well. Additionally, political stability and the nation’s central bank policy are big drivers of the rand.
It should also be noted that the South African economy will receive 20 million vaccines by mid-April. This should be seen as a major positive in the short-term, especially if we consider that South Africa has had its own COVID-19 variant, which is seen as being a more deadly strain than others.
With gold is recovery mode and the greenback on the defensive we are therefore seeing the USDZAR pair extremely close to breaking down below its well established four-month range band.
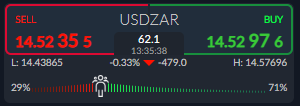
Sentiment towards the USDZAR pair is providing further red flags. The ActivTrader Market Sentiment tool shows that some 71 percent of traders are bullish towards the pair, despite the strong multi-day decline.
Typically, retail traders lean against prevailing market trends, so the down move could continue here and if a range break does occur then technical selling could ramp up significantly below the $14.40 level.


