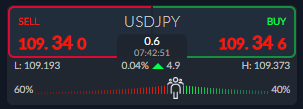
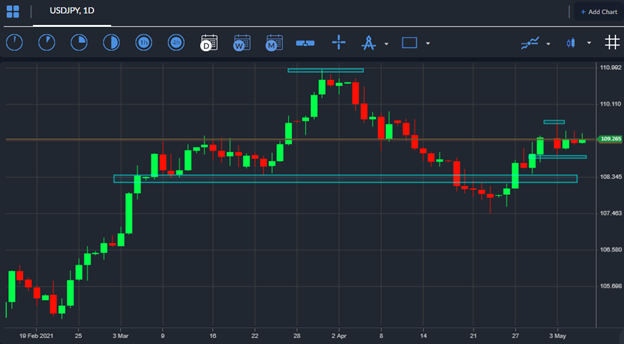
The US dollar has recovered back above the 109.00 level, and its 200-day simple moving average, against the Japanese yen as the US dollar index continues to catch a strong bid on the foreign exchange market.
Investors are currently optimistic about the uptick in US growth as the effects of the pandemic wane. Even the weaker-than-expected ISM manufacturing number this week failed to dent bullish sentiment towards the world’s largest economy.
A return of risk-off trading sentiment also failed to sink the USDJPY pair on Tuesday, as market fears about rising inflation and the FED tapering QE emerged. It would seem that the USDJPY pair remains well-supported ahead of this Friday’s Non-farm payrolls job report.
The good news for USDJPY bulls is that the greenback is likely to rise if the market believes that the FED may taper sooner than expected. Some FED members have even been out on the wires this week calling for a discussion about tapering.
Another key point is that the vaccine rollout has prompted optimism towards the economy and the US dollar. This is showing up in the data with American hiring numbers, and the Biden administration are set to implement more stimulus in the form of infrastructure spending.
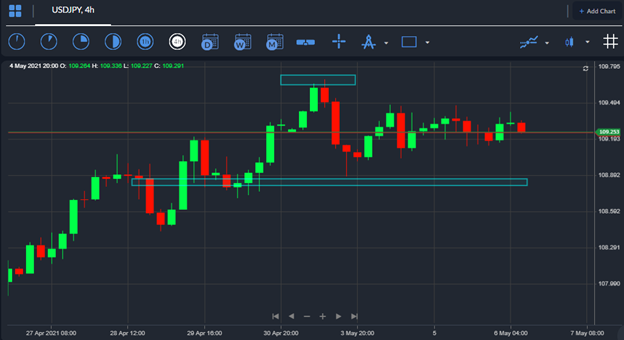
The technical backdrop is much more bullish while the USDJPY pair trades above the 109.00 handle, however, continued gains above the 110.00 level would make it hard to justify a continuation of the late April pullback in the USDJPY pair.
According to the ActivTrader Market Sentiment tool some 60% of traders are bearish towards the pair. Bearish sentiment has increased since last week, however, the price has just continued to rise. This sets up the scenario for a major retail trader short squeeze, and therefore more upside in the USDJPY seems likely while the negative sentiment amongst the retail herd stays in place.


