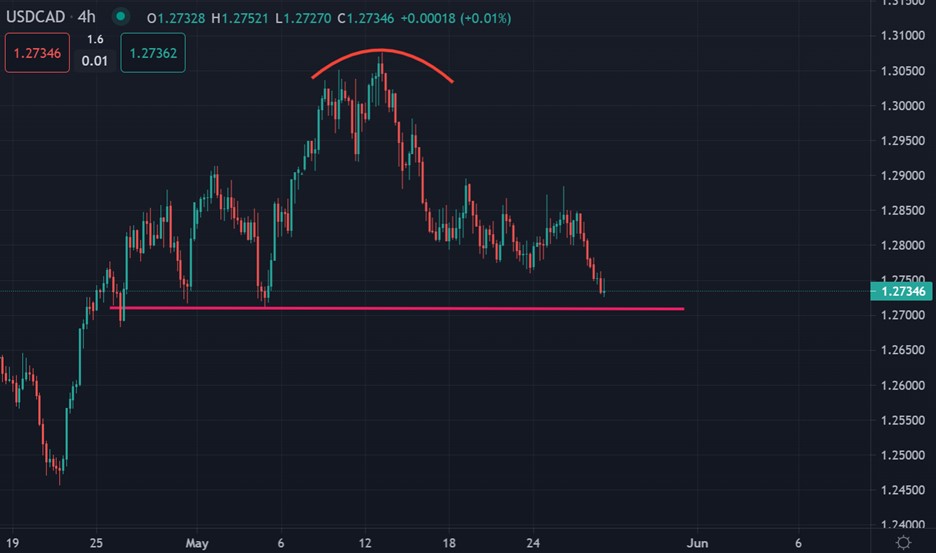
The US dollar is trading at its weakest against the Canadian dollar since the start of May due to the big reversal to the downside in the buck last, which was broad based and the fastest sell-off this year.
As has been apparent in recent months, equity markets remain the key driver for the Canadian Dollar. Therefore, with the upside in equities tentative at best and the bias very much a sell on rallies, dips in USD/CAD are likely to be supported.
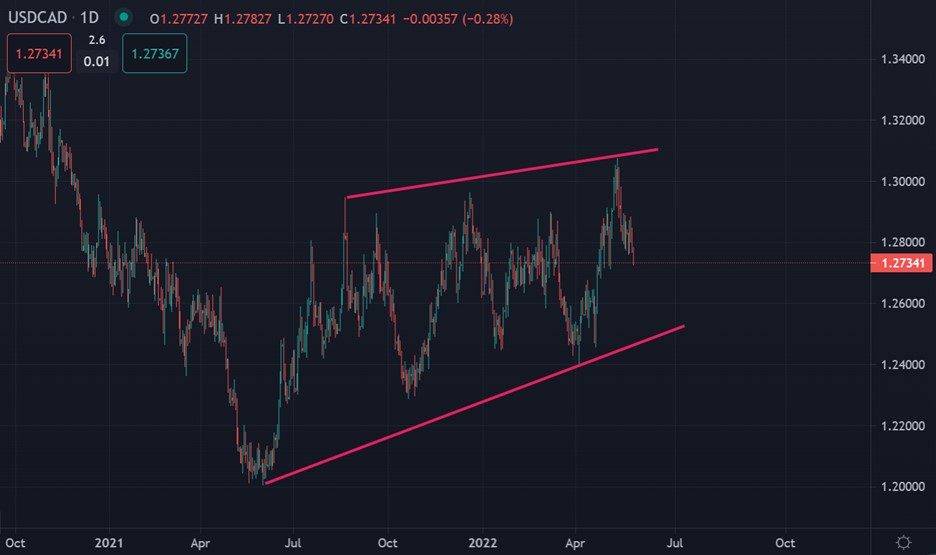
Additionally, the USD/CAD vs rate differentials and oil prices signal that the pair could be in for a period of consolidation before the next big month. Next weeks FED interest rate decision could give some reprieve for the USDCAD pair, however, as things stand we do need to keep a close watch on the 1.2500 support zone.
This week Canadian retail sales is on tap, this will unlikely prompt a notable move in the Loonie given that the data will not move the needle for BoC policy. As a reminder, the Bank of Canada is expected to raise interest rates by 50bps at its upcoming.
With this in mind, traders are likely to look for opportunities to sell rallies in the short-term, and we could see some more temporary USDCAD weakness until the next Fed meet.


