The US dollar is suffering technical setbacks against the Canadian dollar, due rising oil prices and failure in the US dollar index to stage a definitive breakout to fresh monthly highs.
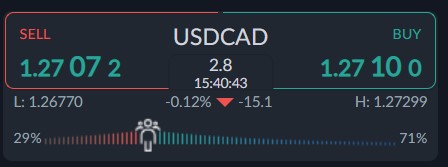
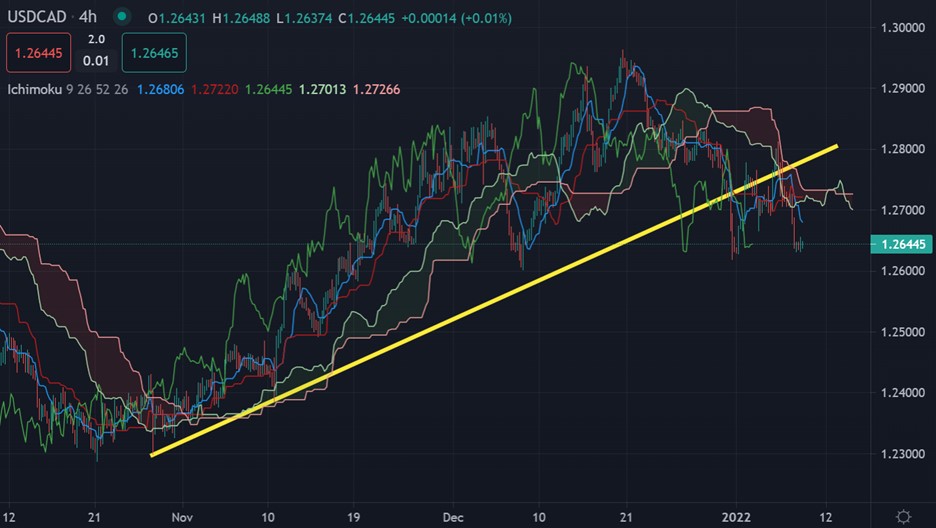
Last week the USDCAD pair traded in a wide range between the 1.2600 and 1.2800 level, with rallies very much being sold and towards the top of range as downside momentum gained traction.
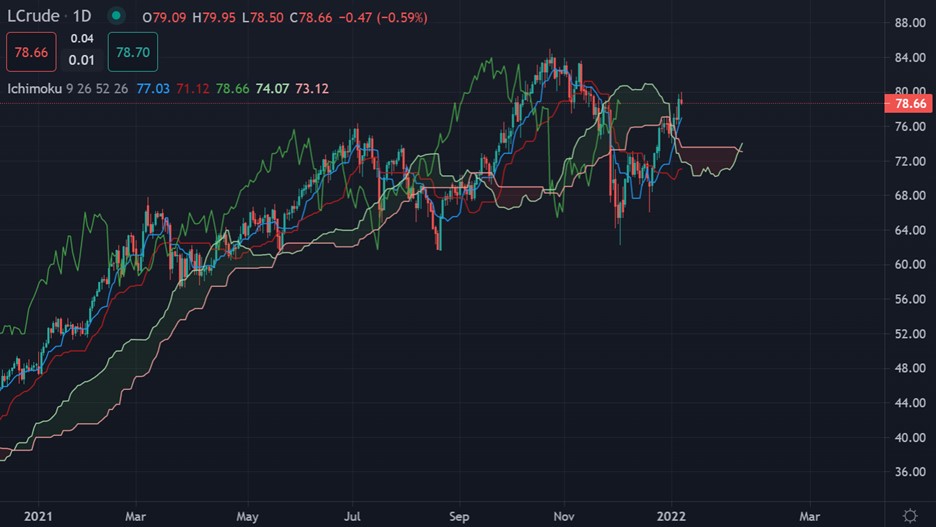
In order for the USDCAD pair to rally bulls need to see oil prices declining back towards $70.00 or indeed a breakdown to the upside in the US dollar. If we see both then it could be a potent combination.
Should we see this fail to materialize then we are likely to see the USDCAD pair extending the lower trading range towards the 1.2500 price area, and the pair settling in between 1.2500 and 1.2600.
It should be noted that political uncertainty coming from Kazakhstan has been a big driver of oil prices. The country is a major oil producer, so news coming from this country will impact crude.
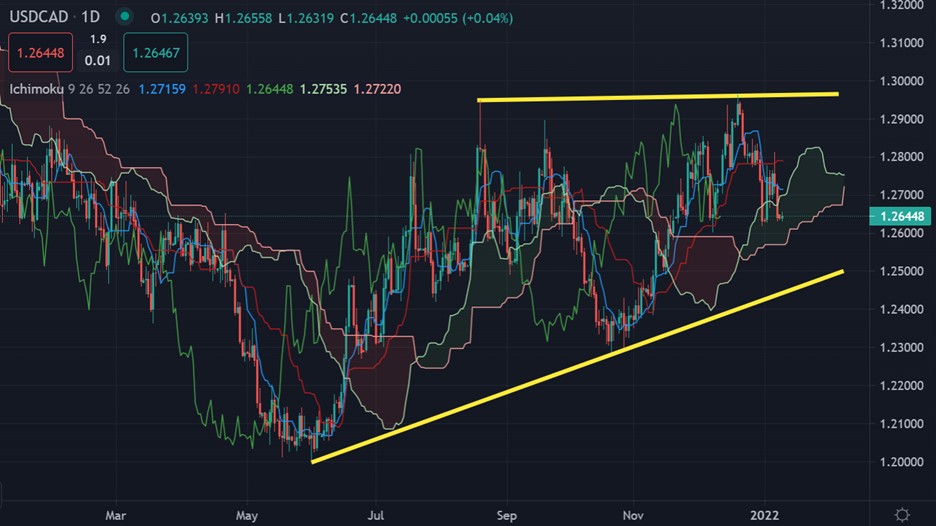
To the upside, we almost certainly need to see a number of daily price closes above the technically important 1.2840 resistance zone, which has been a great trading pivot since 2020.
For now, traders are focused on the release of CPI inflation and Retail Sales data from the United States economy, and also the latest news surrounding oil prices and of course Omicron.


