The US dollar is finally balanced against the Canadian dollar ahead of the Bank of Canada kept interest rate decision, with most market commentators expecting the central bank to taper QE once again and hold the lending rate unchanged at 0.25 percent.
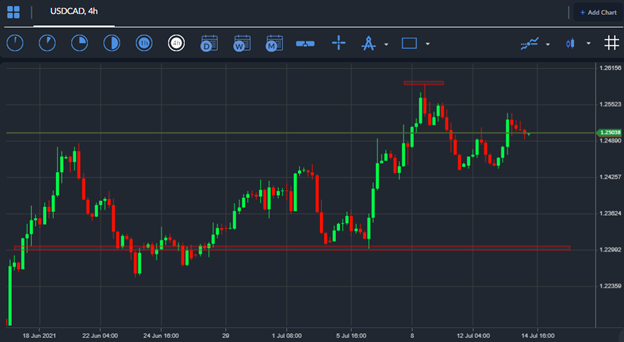
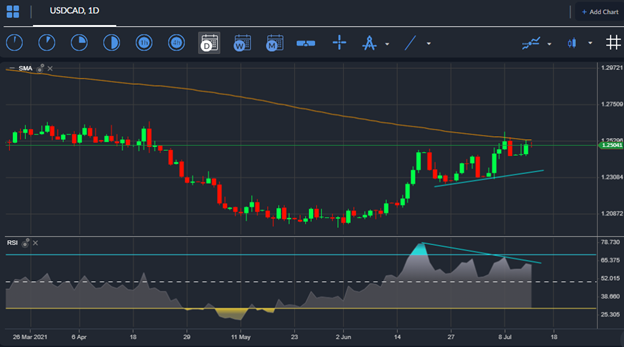
Last week the USDCAD tested its key 200-day moving average for the first time since July 2020, as the pair traded just short of the 1.2600 level. A severe drop in the price of oil due to an ongoing spat between key OPEC nations caused a major sell-off in the Canadian dollar.
Things have improved since last Friday as oil prices largely stabilize and the Canadian jobs report came in red hot, with a 230,700-headline number. The US dollar has also started to strengthen since causing the USDCAD to trade back towards the 1.2500 level.
More big moves in the USDCAD pair could be forthcoming according to major investment bank Goldman Sachs. The banks noted about the upcoming BOC meeting “while tapering seems widely expected this week, the tone from the meeting or inflation forecast revisions in the MPR could result in some reaction from the Canadian dollar”.
The bank added “We think the central bank’s concerns about a stronger CAD versus USD due to policy divergence have probably eroded somewhat when the Fed brought forward its tightening timeline at the last FOMC meeting, the main catalyst for the BoC’s concerns about the exchange rate was diminished”.
Very simply USDCAD bulls will need to take-out the 200-day moving average in order for a new bullish trend to form. High levels of positive sentiment still exist towards the USDCAD pair, with 76 percent of traders predicting more gains.


