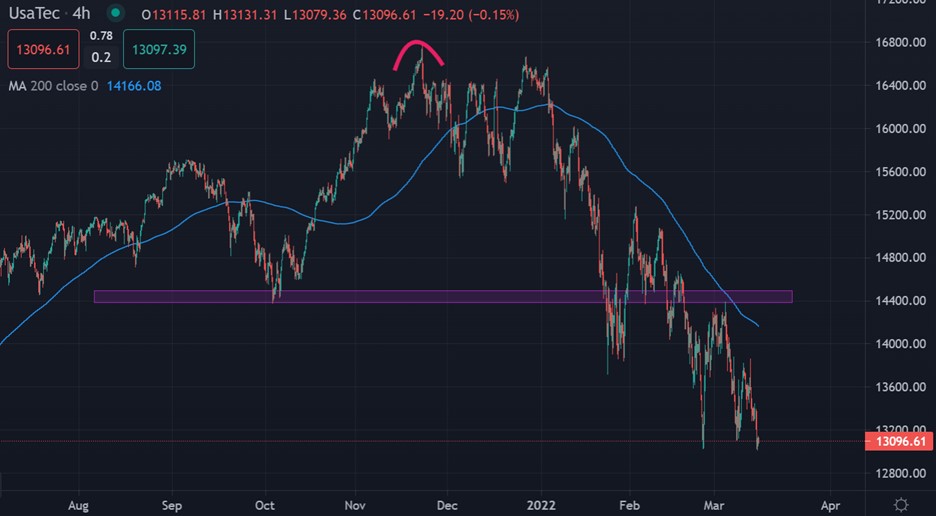
The Nasdaq has moved back towards the 13,000-support level as the leading tech index in the United States continues to be affected by the Ukraine war, and potentially adverse economic conditions comings down the pipeline.
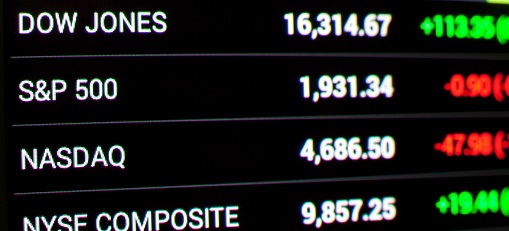
Tech stocks are taking a hammering, as rising inflation and fears of a hike from the FED this week promises to tighten the pocketbook of many US consumers, whom many technologies and online stock rely upon.
Additionally, the news flow from the Ukraine war is going from bad to worse, with the prospect of China providing aid to Russia now looking increasingly likely, further raising the stakes in the Ukraine war.
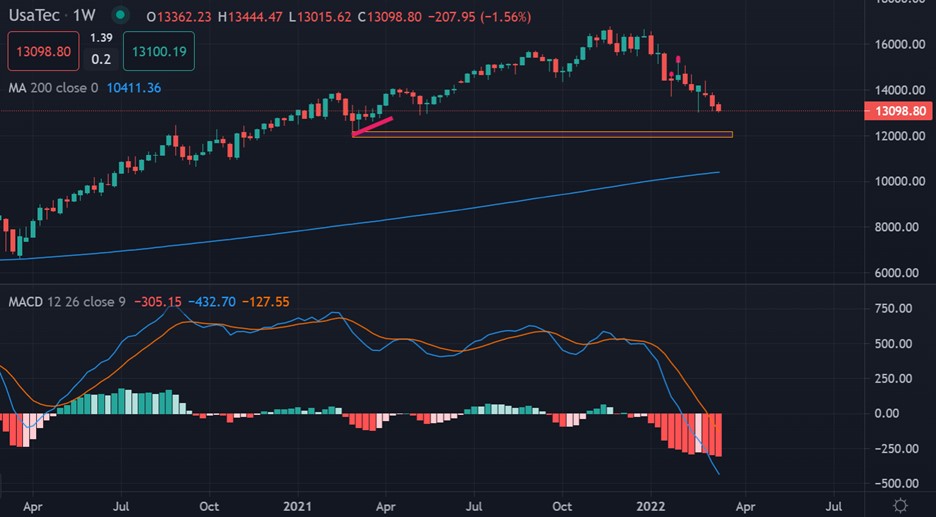
The chart of the Nasdaq is strongly alluding to further heavy losses following the recent strong upside rejection, from around the 14,400-resistance zone. Bears look to be targeting the 12,000 level.
For all intents and purposes the FED are likely to raise rates, it then becomes a question as to how hawkish the FED are going to be towards future rate hikes, and indeed what they will say about economic conditions.
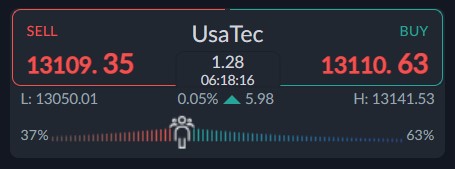
The ActivTrader market sentiment tool is showing that some 63 percent of traders are bullish towards the US dollar index, which is a decrease of around 3 percent since last week.
The fact that sentiment is rising is worrying for Nasdaq bear. Especially given the big 1,400 price drop recently. I would suggest keeping a close eye on sentiment over the coming days, as we probably need a bearish bias forming before a bottom is in place.


