The US dollar index is dropping hard on the foreign exchange market as the greenback fails to recover, despite last Friday’s extremely strong PMI services and manufacturing headline numbers from the United States economy.
Traders and investors are failing to believe that the Federal Reserve are moving closing to talking about tapering QE, as some FED members alluded to last week. The positive April PMI numbers from the US failed to offset the disappointing Non-farm payrolls job report last month.
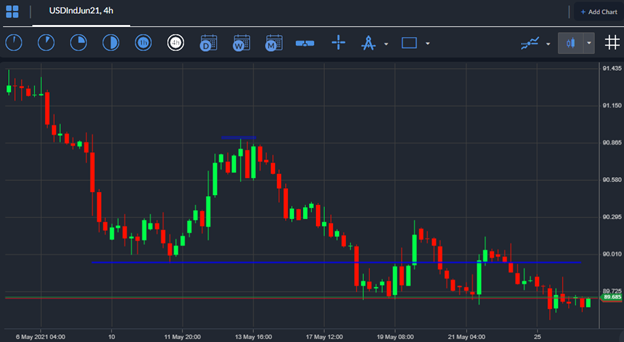
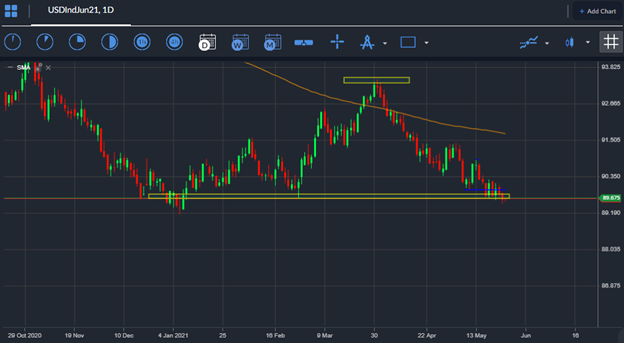
On the technical front, the US dollar index is very bearish. The US dollar index sits on the cusp of a technical meltdown as the price is starting to breakdown under the neckline of a massive head and shoulders pattern.
Bears have eroded last week’s gains at start of this week as the index slips under the 90.00 level, bulls are facing the mammoth task of needing to the rally the US dollar index by almost 400 points to invalidate the mentioned bearish price pattern.
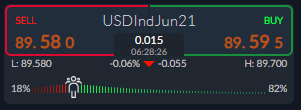
Looking at market sentiment, the ActivTrader Market Sentiment tool shows that some 82 percent of traders are bullish towards the US dollar index. This one-way sentiment skew is issuing a warning that traders are way too bullish.
Retail traders are on the right side of the trend in increasingly worrying numbers. I tend to believe that another major leg lower is starting to commence if we factor in the huge bullish bias right now. Majors like the EURUSD and the GBPUSD pair could be on the way to a new 2021 trading high.


