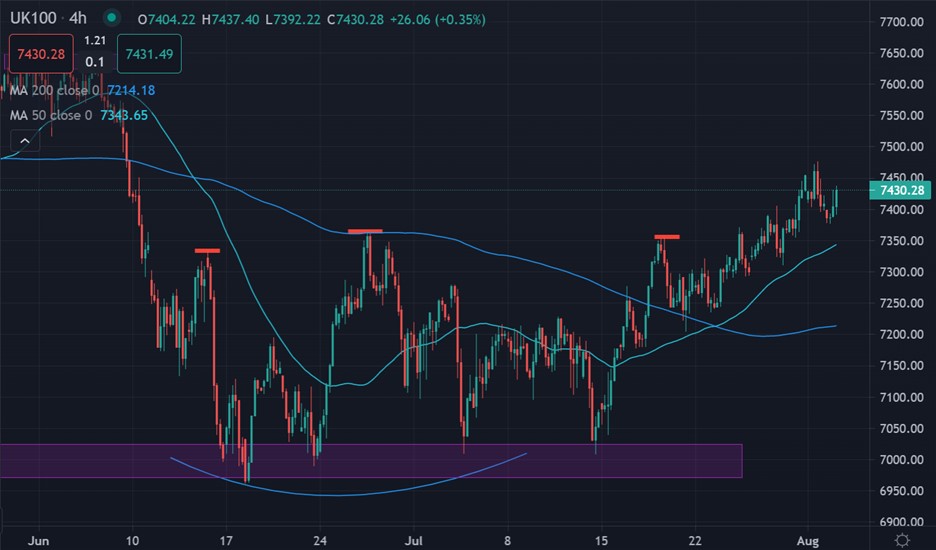
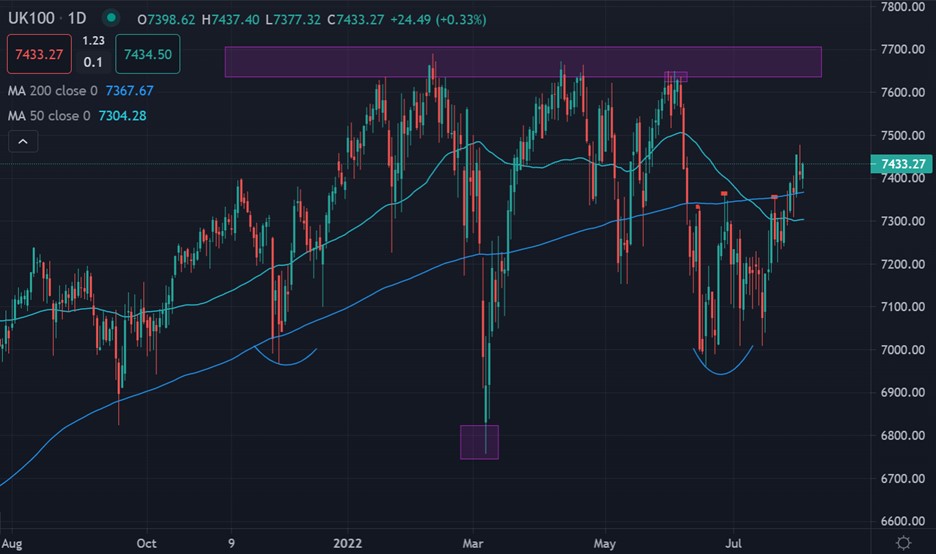
The FTSE 100 has started to look bullish over recent days after we saw a break of the 7,000 to 7,360 price range, which set the leading UK index in an upward price direction.
Most of the gains we are seeing in UK stocks appear to be driven by momentum in USA stocks, which have been leading market sentiment over the past week or so.
Traders appear not too bothered about the potential for a large rate increase from the Bank of England. Usually, rate increases put pressure on stocks, but this time it appears not so much.
Additionally, we have seen strength in the British pound. Currency strength in the United Kingdom is usually a headwind for stocks. Again, the market is looking past the usual inverse relationship between the two.
Bond yields have been falling. This could be a reason why traders are searching for stock gains. A yielding asset like dividend stocks could be luring in money that is leaving the UK bond market.
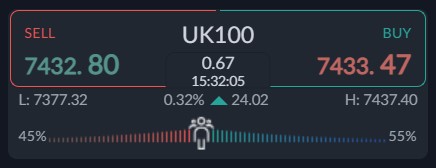
Sentiment towards the UK100 is almost neutral right now. According to the ActivTrader platform, only 55 percent of traders are bullish towards the UK100. This is typical of range bound market. The UK100 could continue to range, as the charts in the technical analysis section below certainly suggest.


