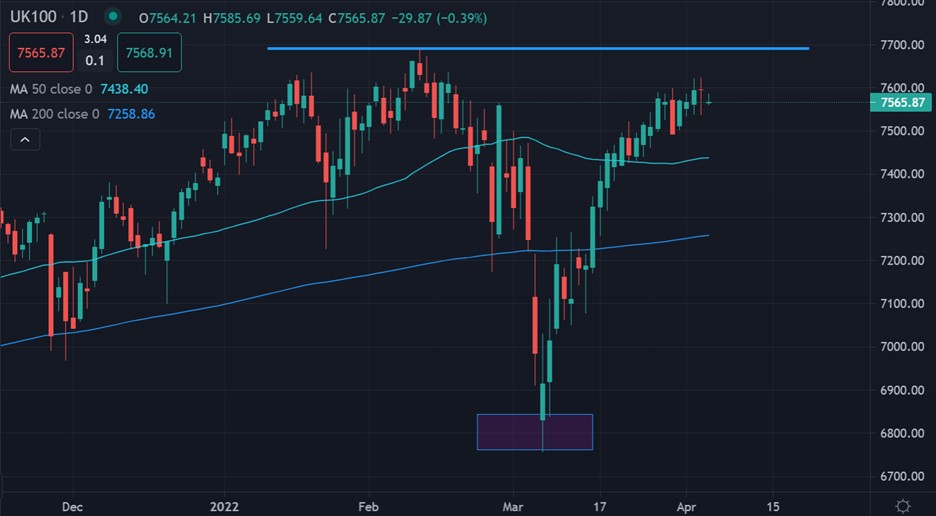
The FTSE 100 index has advanced towards the 7,600-resistance level, hitting a new multi-week high this week of 7,620, despite US and Chinese stocks suffering a terrible time thus far.
One thing is apparent with the UK100, the index looks far more bullish than other global index’s right now, and we could be about to see a spectacular move higher at some point in the not-too-distant future.
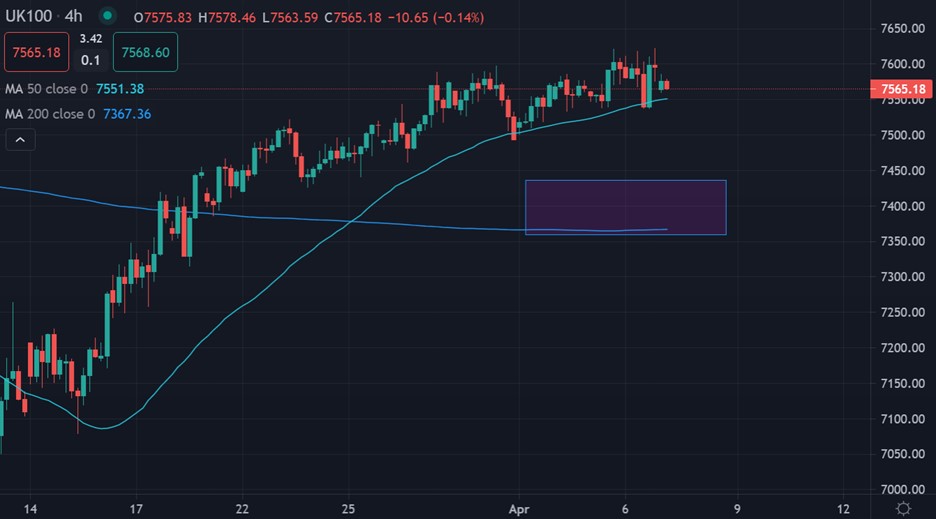
Traders that bought the dip under 7,000 have been rewarded with a 600-point gains, and this theme looks set to repeat itself if we see the FTSE100 moving back towards the 7,500 to 7,400 area again.
Buyers are very close to edging price towards the current yearly high, around the 7,700 level. This would complete a huge reversal pattern, which strong hints at more future price gain well above the 8,000-resistance level.
Traders are starting to turn less bearish towards the UK100, so we could see a correction coming. This is usually how it works with sentiment, as retail consistently remain on the wrong side of the trade.
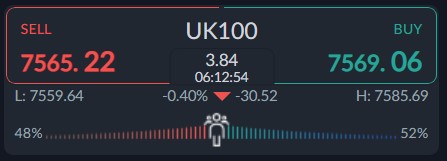
Sentiment towards the UK100 is basically neutral right now. According to the ActivTrader platform over 48 percent of traders are bearish towards the UK100. This is hinting at range bound trading this week.
Typically, the retail crowd is on the wrong side of the trade more often than not, so the UK100 could correct at any time this week and month. Retail is remained less cautious right now, which is not a good sign.


