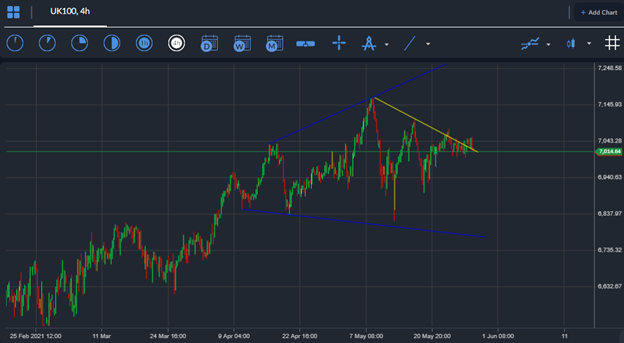
The FTSE 100 traded in an extremely narrow price range last week, with the Average True Range on the four-hour time frame dipping to level not seen since late-April as volatility and volume dried up.
Perhaps the old adage sells in May and go away came to pass for UK stock this month as very little buying interest has been seen above the 7,000 level despite the FTSE100 rallying sharply this year.
Inflationary pressures in the UK could be keeping stock traders on edge. Rising interest rates are typically not a friend to the FTSE100 when investors are searching for yield and pension funds are looking to park their money.
Last week much of the focus was on the United States as weekly jobless claims dropped to their lowest level since March 2020 and US core PCE hit a high of close to thirty years.
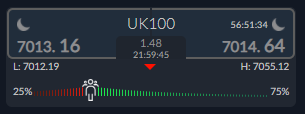
Looking at sentiment, traders are turning more bullish towards the FTSE100. This is a bad sign, as extremely positive sentiment amongst the retail crowd towards the FTSE100 has rarely been price positive.
Bullish sentiment towards the UK100 may need to drop before we see the index finally starting to take-off above the 7,000 and reach many analysts upside target for the FTSE100, which is around 7,500 to 7,800.
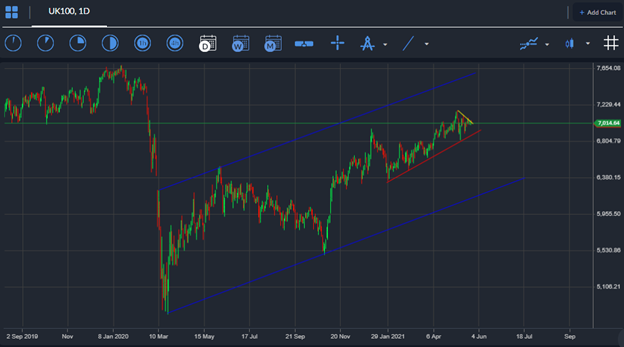
Once sentiment drops to negative territory I would be very cautious about being short the FTSE100 as the index could rally sharply and not look back for some time. This is what the charts are alluding to anyway.


