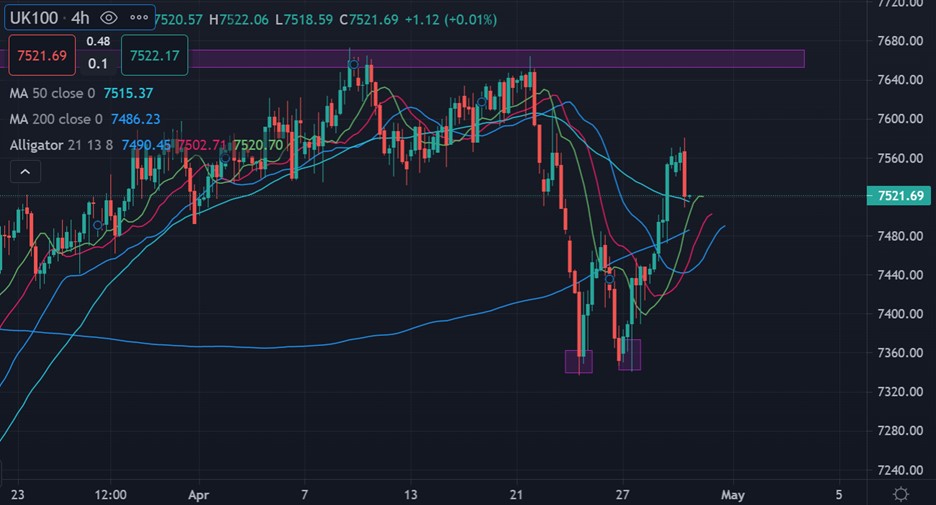
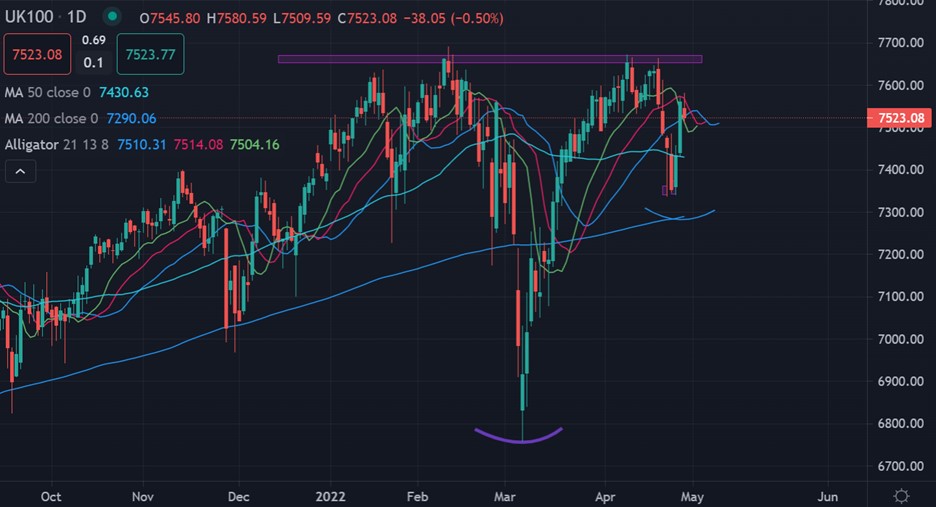
The FTSE100 has started to rebound sharply after last week’s worrying price dip towards the 7,300-support zone was quickly met with a raft of fresh buying interest from UK stock buyers.
Sterling also dipped sharply last week under the 1.2500 price and moved into levels not seen since the Brexit aftermath, however, sterling has yet to recover much, but the UK100 is looking much more bullish.
It could be time to take a close look at the inverse relationship between the UK100, and potentially it could be helpful to the UK economy, as its goods are now going to be much cheaper.
However, the British pound has not been falling sharply against other countries, and it has been actually rising against the Yuan. However, we do need to recognize that the UK100 and Sterling have previously enjoyed a strong inverse price correlation.
This week UK100 traders also must contend with another bout of risk events coming from the Fed rate decision, and more importantly for UK stock traders, the BoE policy decision.
Governor Bailey raised concerns about the risks of persistent inflationary pressure from a strong labour market, with rising wages causing higher inflation for longer. Which recently prompted profit taking in the UK100.
I think that the UK100 is still likely to head higher this week, as the BoE may be slowing its rate rising cycle, which is good for stocks, as investors remain on the hunt for yield in a low growth environment.
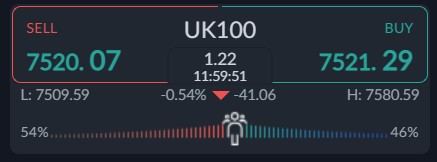
Sentiment towards the UK100 is also bearish right now. According to the ActivTrader platform over 54 percent of traders are bearish towards the UK100. This is a drop since last week.
Typically, the retail crowd is on the wrong side of the trade more often than not, so the UK100 could continue to rise this week and month, which the price action and chart certainly suggests is possible.


