The FTSE100 has moved to its highest trading level in four years last week and also posted its fourth consecutive day of trading gains as the breakout above 7,700 sparked more buying.
Despite the weak fundamentals of the UK traders are piling into UK shares, such as Shell, which closed at a 9-month high on Friday, as natural gas prices continued to gain upside traction.
Also, medium-term hopes for a Chinese recovery were again in evidence, as the miners edged towards the top of the leader board. The FTSE100 is heavily exposed to the mining and energy sectors.
The likes of Rolls-Royce and Prudential also gained ground. If we consider China to be a hotbed of wealth that it is natural to make the connection behind the COVID-19 lockdown easing and China stocks rallying
The pound also fell to its lowest level since mid-November last week as investors braced for US jobs data that will help chart the path forward for Federal Reserve monetary tightening.
Usually, the UK100 shares an inverse price correlation with the sterling. This is somewhat as the sterling heads lower, while the UK100 starts to gain tremendous upside traction in January.
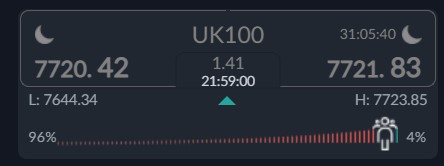
Sentiment remains extremely bearish, which could be great for further price gains ahead for the UK100. With retail looking to short we could see the FTSE100 holding above the 7,700 level.
If we look at the ActivTrader Market Sentiment tool, 96 percent of traders are currently bearish. This metric has risen by over 4 percent since last week.
However, this sentiment bias does look very overstretched. In such instance a correction lower is also possible, although equally the short squeeze could just continue.
Based on the current sentiment reading I think it is highly probable that we could see the upside starting to accelerate.
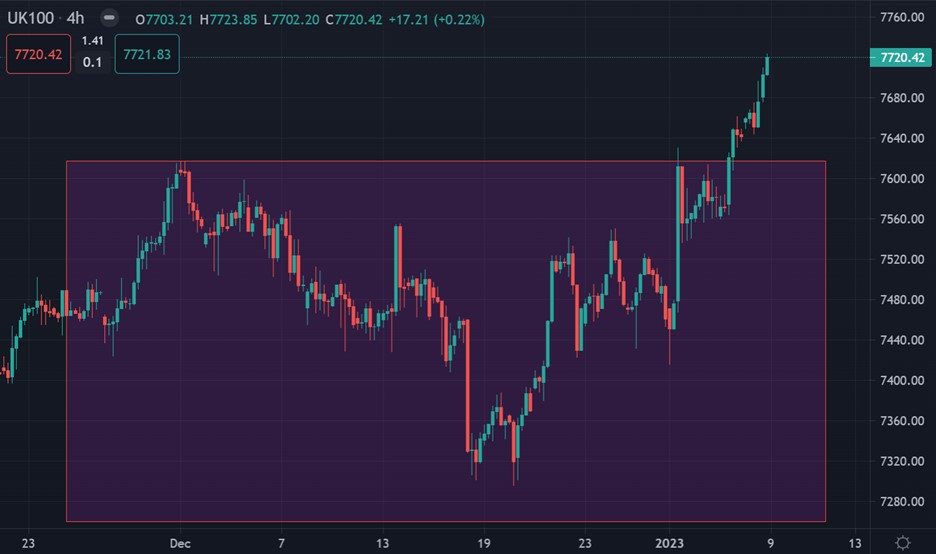
UK100 Short-Term Technical Analysis
According to the four-hour time frame the UK100 has started to trade towards the 8,000 area and also it has formed a bullish breakout with a 300-350 point upside projection.
With the bullish inverted head and shoulders pattern that formed, I would suggest keeping a close watch on the 7,600 level for support and then incoming gains towards 8,900.
See real-time quotes provided by our partner.
UK100 Medium-Term Technical Analysis
The daily time frame shows that the UK100 as buyers broke a 1-year trendline, and this technical breakout has now activated a much large reversal pattern on the mentioned time frame.
If we see the UK100 starting to hold endline resistance, then move towards the 8,500 to 9,000 area is possible. All eyes will be on a huge trendline breakout next week.
See real-time quotes provided by our partner.