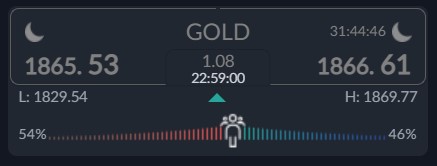
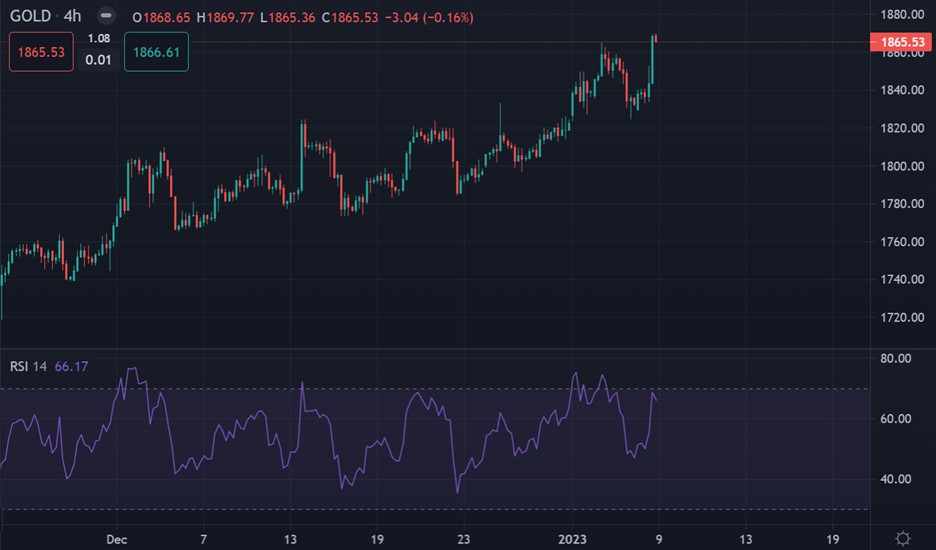
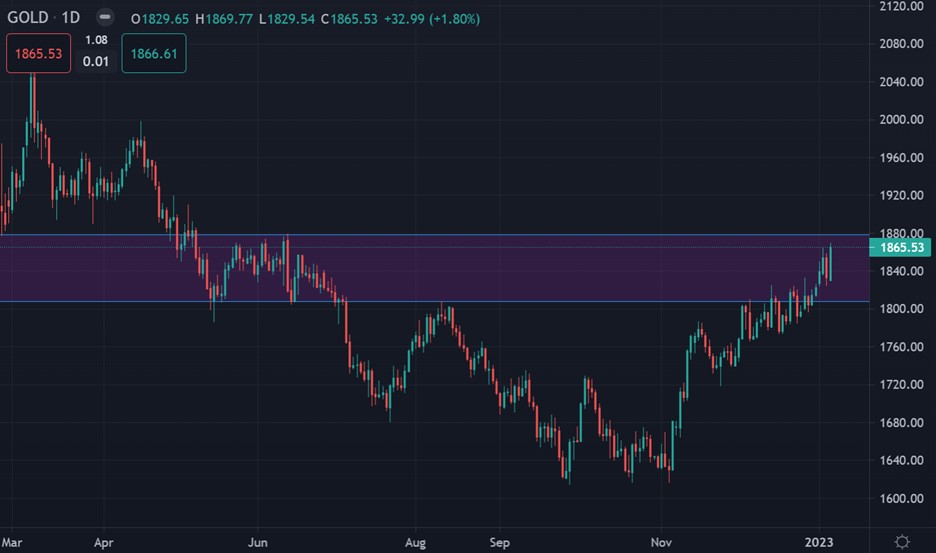
Gold closed the week at its highest level since June last year as the yellow metal surged, following the release of the ISM manufacturing release and the NFP jobs report from the US economy.
For large parts of the past few years, gold competed with crypto for a segment of the investing population’s attention. Though gold didn’t achieve anywhere near the upside of bitcoin, it’s also avoided the downside and much of the volatility.
The turmoil in the crypto space may be drawing some interest back to gold. Gold has certainly the shine away from Bitcoin lately with the FTX scandal engulfing the number one crypto.
Also, demand for gold rose by 28% last year, primarily driven by a flight towards safer assets amid soaring inflation. A significant amount of this demand has come from central banks in recent months.
At the same time, countries not friendly with the United States appear to be turning towards gold after Russia’s dollar reserves were locked down. Sovereign gold buying — including from China surged in Q3 and that likely continued in Q4.
Current sentiment metric towards gold shows that sentiment has become slightly less bullish, which still hints that retail are leaning towards more gains this week.
The ActivTrader market sentiment tool shows that 46 percent of traders are bullish towards gold. Going forward, we really need to see a negative bias by retail to help the chances of a sustained recovery.
Gold short-term Technical Analysis
According to technical analysis gold the price of gold could head even higher after a head of a head and shoulders pattern on the four-hour time frame was invalidated.
These type of pattern invalidations are usually very bullish when they are invalidated. In theory, if the restest of $1,880 and it holds then we could see a push back towards the range low, around $1,820 level or a breakout could cause a major price surge.
See real-time quotes provided by our partner.
Gold Medium-term Technical Analysis
The daily chart shows that the yellow-metal has moved break of the resistance at $1,877 would also highlight a rough inverted head-and-shoulders pattern on the daily chart.
Traders be warned that the mentioned bullish price pattern has a measured target of $1,975. In short, medium-term traders need to watch the $1,880 area closely this week.
See real-time quotes provided by our partner.