The FTSE 100 has been rallying away from the 7,000 level over recent days due to a rally in stocks in the United States as market participants expect a 75-basis point hike instead of the feared 100 basis points increase.
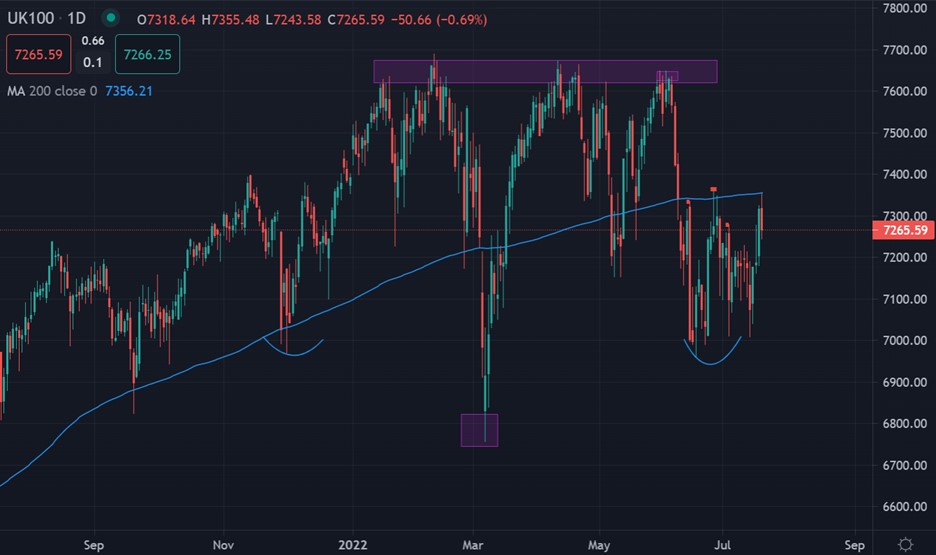
Bulls and bears are evenly matched at the moment as bearish head and shoulders pattern across the lower time frames does battle with a large, inverted head and shoulders pattern on the higher time frames.
Another reason why the FTSE100 could be rallying is that Rishi Sunak is seen as a safer pair of hands if he lands the top job from PM Johnson. Any political certainty is better than uncertainty.
UK economic data also held firm this week. The UK’s unemployment rate held at 3.8% in the three months to May and the number of people in work rose by the most since the middle of 2021.
However, higher wages paid by the private sector will serve to entrench inflation, while the small pay rises witnessed in the public sector in the face of soaring prices will continue to stoke industrial tensions.
Going forward, technical traders need to see a break of the 7000 to 7,360 price range before they are really sure about the direction of the FTSE100. The index is currently in no-man’s lands.
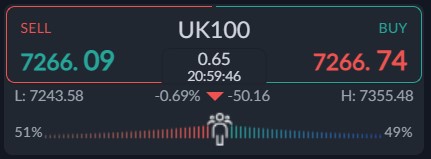
Sentiment towards the UK100 is almost neutral right now. According to the ActivTrader platform only 49 percent of traders are bullish towards the UK100. This is typical of range bound market. The UK100 could continue to range, as the charts in the technical analysis section below certainly suggest.


