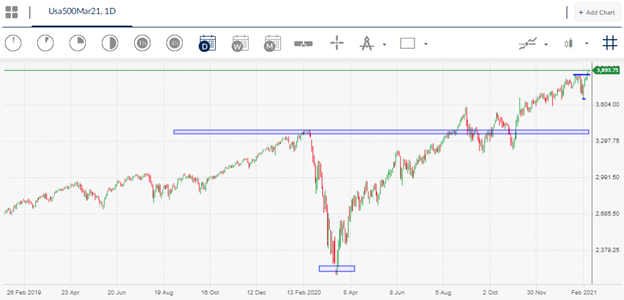
The S&P500 looks increasingly solid on both the technical and fundamental front at the moment, as the index quickly approaches another milestone, namely the 4,000-resistance level.
From a fundamental perspective the prospect of continued QE from the FED after last week not so impressive monthly US jobs, and another massive $1.9 trillion package from the Biden administration are huge positives.
Despite the frothy appearance of some of the heavyweight companies on the S&P 500 in terms of valuations, much can say about buying into stocks and US indices before the expected post-COVID-19 economic recovery commences.
The S&P500 could simply continue to rise based on the fact that QE and stimulus will be rolled-out indefinitely. This simplistic approach may appear to be somewhat of a risky trade, however, this is trade that has been working since April last year.
My feeling is that the S&P500 will easily break 4,000 this year based on the technical alone. Barring any unforeseen events, be it political or geo-political, buying into dips in expectations of an eventual breach of 4,000 levels seems a worthwhile bet.
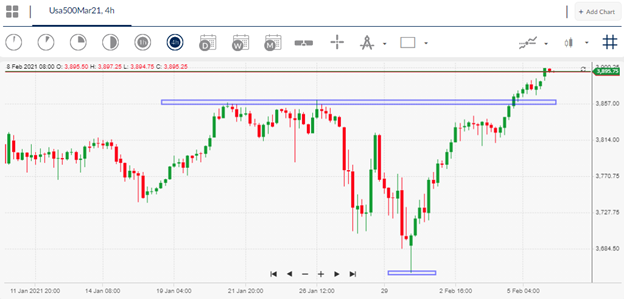
Various technical patterns are pointing to the S&P500 trading much higher over the medium-term, hence dips are for buying. Many of the European index’s also have very strong bullish patterns at this current juncture.
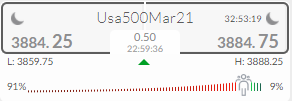
Something else extremely interesting to note is that over 90 percent of traders are currently bearish towards the S&P 500 index. Such a bearish one-way skew while price is rising is a big clue that that index will probably continue trading higher.
I would expect a technical correction back towards 3,800 at some stage if the sentiment towards the index neutralizes, however, if it remains around current levels then expect the 4,000 level to be challenged very shortly.