The S&P 500 has tumbled sharply lower last week, and also turned heavily negative on the year so far, due to the ongoing Ukraine/Russia tensions and the notion that we could see a much-more hawkish stance from FED policymakers this week.
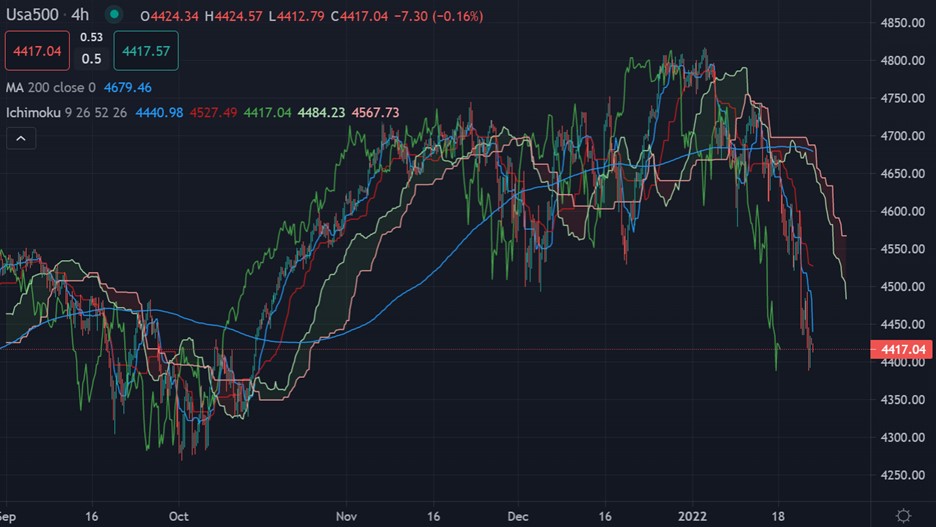
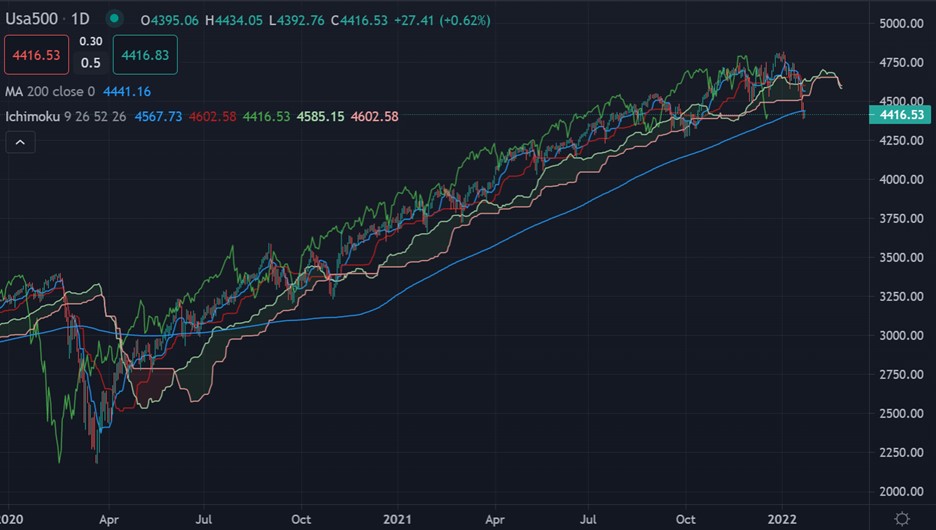
Interesting technical occurrences have also happened to the S&P500. The index is testing its key 200-day moving average and is also now breaking under Ichimoku cloud support.
The breach of the Ichimoku cloud is an interesting one as it is the first such occasion that the S&P500 has broken under the cloud since the entire bull run, which started in the mid-half of 2020.
From a technical perspective, and in fitting with the correct usage of the Ichimoku cloud, a few things need to happen in order for a sell signal to be officially issued. Meaning it’s safe to sell.
The price crossing the cloud is normally not enough. Typically, traders look for further confirmation by checking that the Lagging Line has also followed the price and moved under the cloud. The lagging line crossed the cloud on Friday, meaning it’s now safe to sell.
In terms of other negative price catalysts, fears of recession, worsening global consumption, and the potential for more COVID-19 infections restrictions over the coming months are all likely to create solid headwinds for the index.
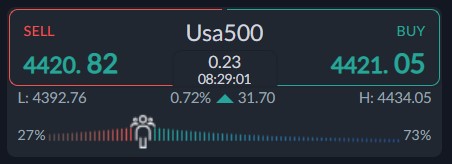
Something else to consider is market sentiment. That ActivTrader sentiment platform shows that nearly 73 percent of traders are bullish towards this market. I believe this is negative because the near-term fundamentals and technicals are quite worrying.


