The S&P 500 started the month in spectacular fashion, as the index raced above the 4,000 level for the first time ever as bullish sentiment spread through broader financial markets, following the Biden administration key speech on infrastructure spending.
Arguably the United States leading index, the S&P 500, had incurred a volatile close to last fiscal quarter, as re-balancing caused a minor drop in the index towards the end of monthly close. However, a 22-point leap on the opening Wall Street propelled the S&P 500 to a fresh all-time record high.
Falling US Treasury yields helped to support market sentiment on Wall Street, following an extended period of uncertainty for the S&P 500 around record highs. Traders and investors appear to be bullish towards the Biden administrations new infrastructure spending bill.
Stock traders also cheered the extremely bullish ISM manufacturing reading yesterday, which came in a multi-decade high. The 64.7 reading far outpaced the 61.5 reading expected by most market participants.
This week’s US Manufacturing PMI release also boosted the S&P 500, as the headline reading for March came in at a solid 59.1. US jobless claims also came in at their lowest level since March 2020 this week, which provided further momentum going into today’s US job report.
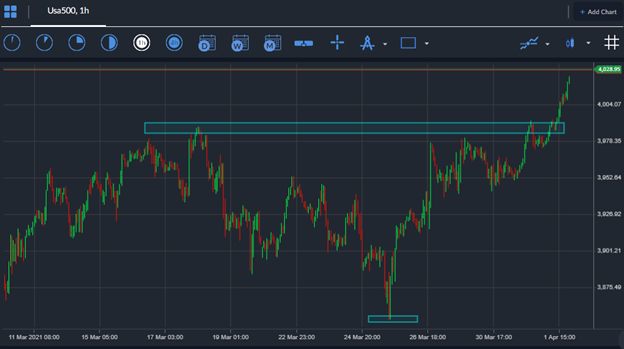
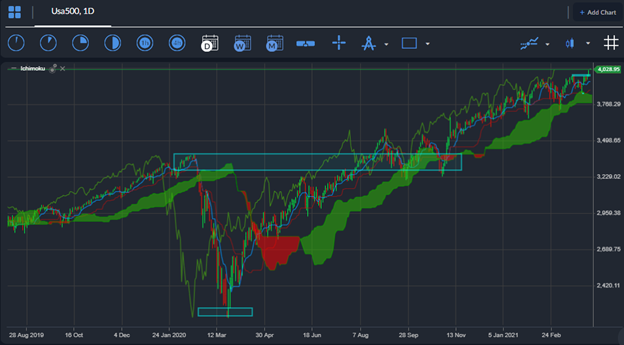
In terms of technicals, lower time frame analysis is pointing to a rally of a further 200 points above the 4,000 level, while the daily time frame is even more bullish, and points to the 4,500-resistance level as potential target.
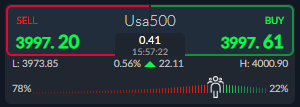
A major positive for the S&P 500 is sentiment. I say that in regard to the major bearish skew that is currently underway. Retail traders are heavily leaning against the current short-term bullish trend and are over 78% bearish. Typically, we should look to trade against the herd.


