The S&P 500 continues to track higher as risk-on market sentiment propels the index into fresh price discovery above the 4,100 level. With the S&P 500 hitting fresh all-time highs on a daily basis price patterns are providing one of the only forms of reliable guidance where the index may find some interim resistance.
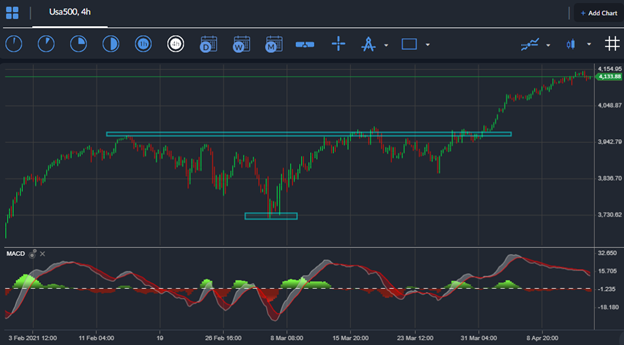
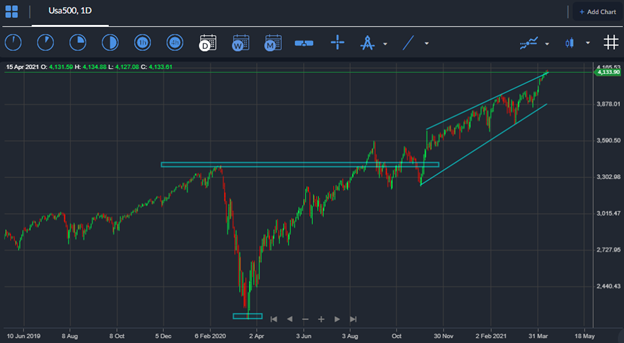
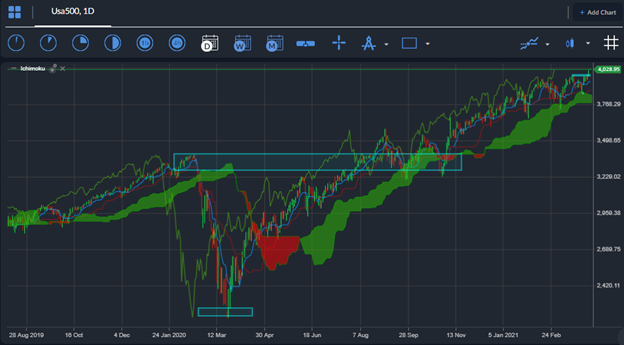
Notable bullish patterns on the lower time frames are highlights the 4,200 level as a highly likely upside price target in the near-term. Patterns on the higher time frames are pointing to the 4,500 level as a likely medium-term price target.
Negative MACD price divergence across the lower time frames has built up during the recent run higher and extends down towards the 4,060 level. This is a potential buy spot trader should bear in mind if a price pullback occurs from the 4,200 or 4,500 levels.
Few reasons currently exist in traders and investors mind for a price pullback, especially with the Federal Reserve meeting minutes last week outlining that the central bank is not in a hurry to raise rates or reduce QE.
Yesterday, FED Chair Jerome Powell failed to talk up the recent string of solid US data releases. Chair Powell and the rest of the Federal Reserve remain convinced that rises in CPI inflation are likely to be just transitory.
This week’s US retail sales report will provide a key indication of how the US consumer is fairing. A solid retail sales report could cause the index to surge even higher, due to the improving economic backdrop and favourable monetary policy conditions.
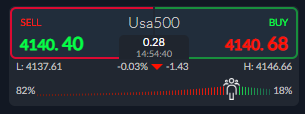
Something else to watch is sentiment. The ActivTrader market sentiment tool shows that 82 percent of are bearish towards the S&P 500 right now, despite the index’s almost constant daily price rises.
Retail traders are increasingly moving into the bearish trade, as a four percent increase in negative sentiment has been recorded this week. Typically, we should look to trade against the herd until proven wrong.


