Market Wrap
See real-time quotes provided by our partner.
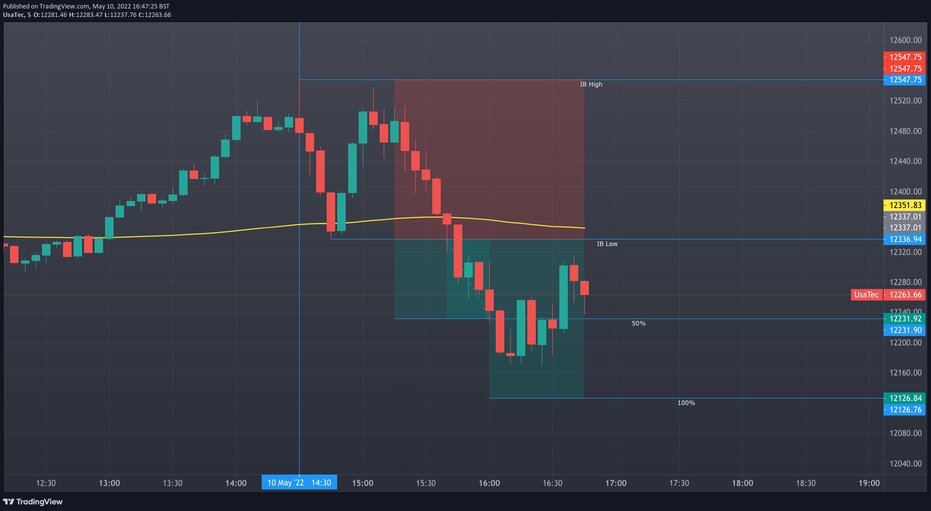
Rather than waiting for a Hedge Fund manager to announce to everyone what he had already done, there is a better way to trade the Nasdaq. Lots of traders watch the 1st hour of trading and wait for a range to be defined. The probabilities that a breakout of that range reaching a full measured move is just above 50%. However, a ½ range extension has a probability greater than 60% which is an actual trading edge. The key is to place your stop somewhere in the IB rather than on the opposite side, to ensure you have a RRR equal or greater than 1:2.
The Dow Jones and S&P500 were lower at the London bell this afternoon, and they were joined by the indices from the Asia-Pac region. The FTSE100 and Nasdaq ended the London session positive and as we have the important CPI data tomorrow, I envisage a reversion to the mean and a range bound finish tonight.
The forex heatmap shows a weakening euro and strong yen and USD. This comes after several central bankers have spoken today. For the ECB we heard from Joachim Nagel who said that the European central bank will begin its monetary policy tightening. Normalising interest rates from July. But that it will be a gradual and data-dependent process. Fed members Barkin and Williams are happy with the continued rate hikes and that there won’t be a recession. Fed’s Mester who has a vote this year said, “we do not rule out a 75bps hike forever.” When discussing what happens if inflation doesn’t ease.
See real-time quotes provided by our partner.
The US dollar is still compressing under the $104 level. My expectations are that we see a higher high in the DXY which will come on the back of a decline in the euro, but also on continued market expectations of higher interest rates from the Fed over the coming 90 days.
See real-time quotes provided by our partner.
The one commodity that could help reduce inflation though is oil and for the second consecutive day we’re seeing the price of energy declining. At the time of writing Brent is down -2.19% for the day and -2.18% over the last week. For the month the energy markets are still in the green but we’re now in low single digits. I was surprised when the breakout occurred to the upside of the triangle, but it is starting to look like that was a fake out and we could have some trapped longs. If they are trapped and puke at the break of the recent swing low, a test of the 200-period averages would be the next target to the downside.
See real-time quotes provided by our partner.
Gold did follow through lower, having entered a consolidation period off a high. The chart pattern we were expecting here and in oil is ‘Drop, Base, Drop’. And Gold is certainly dropping. Breaking through the 200-period average and is on its way to $1800/oz. There is a double bottom below $1700/oz, so I am keen to see if that gets tested too.