Forex Analysis – NZDCAD
Recent developments between the USA and Iran are likely to result in a revival of the nuclear accord before the new Iranian president is declared. With a new Iranian presidential election brings forward the expected increase in Iranian exports to global markets. Analysts predict that Iran would likely be able to raise its exports by 600-900k b/d within three months of the lifting of sanctions.
See real-time quotes provided by our partner.
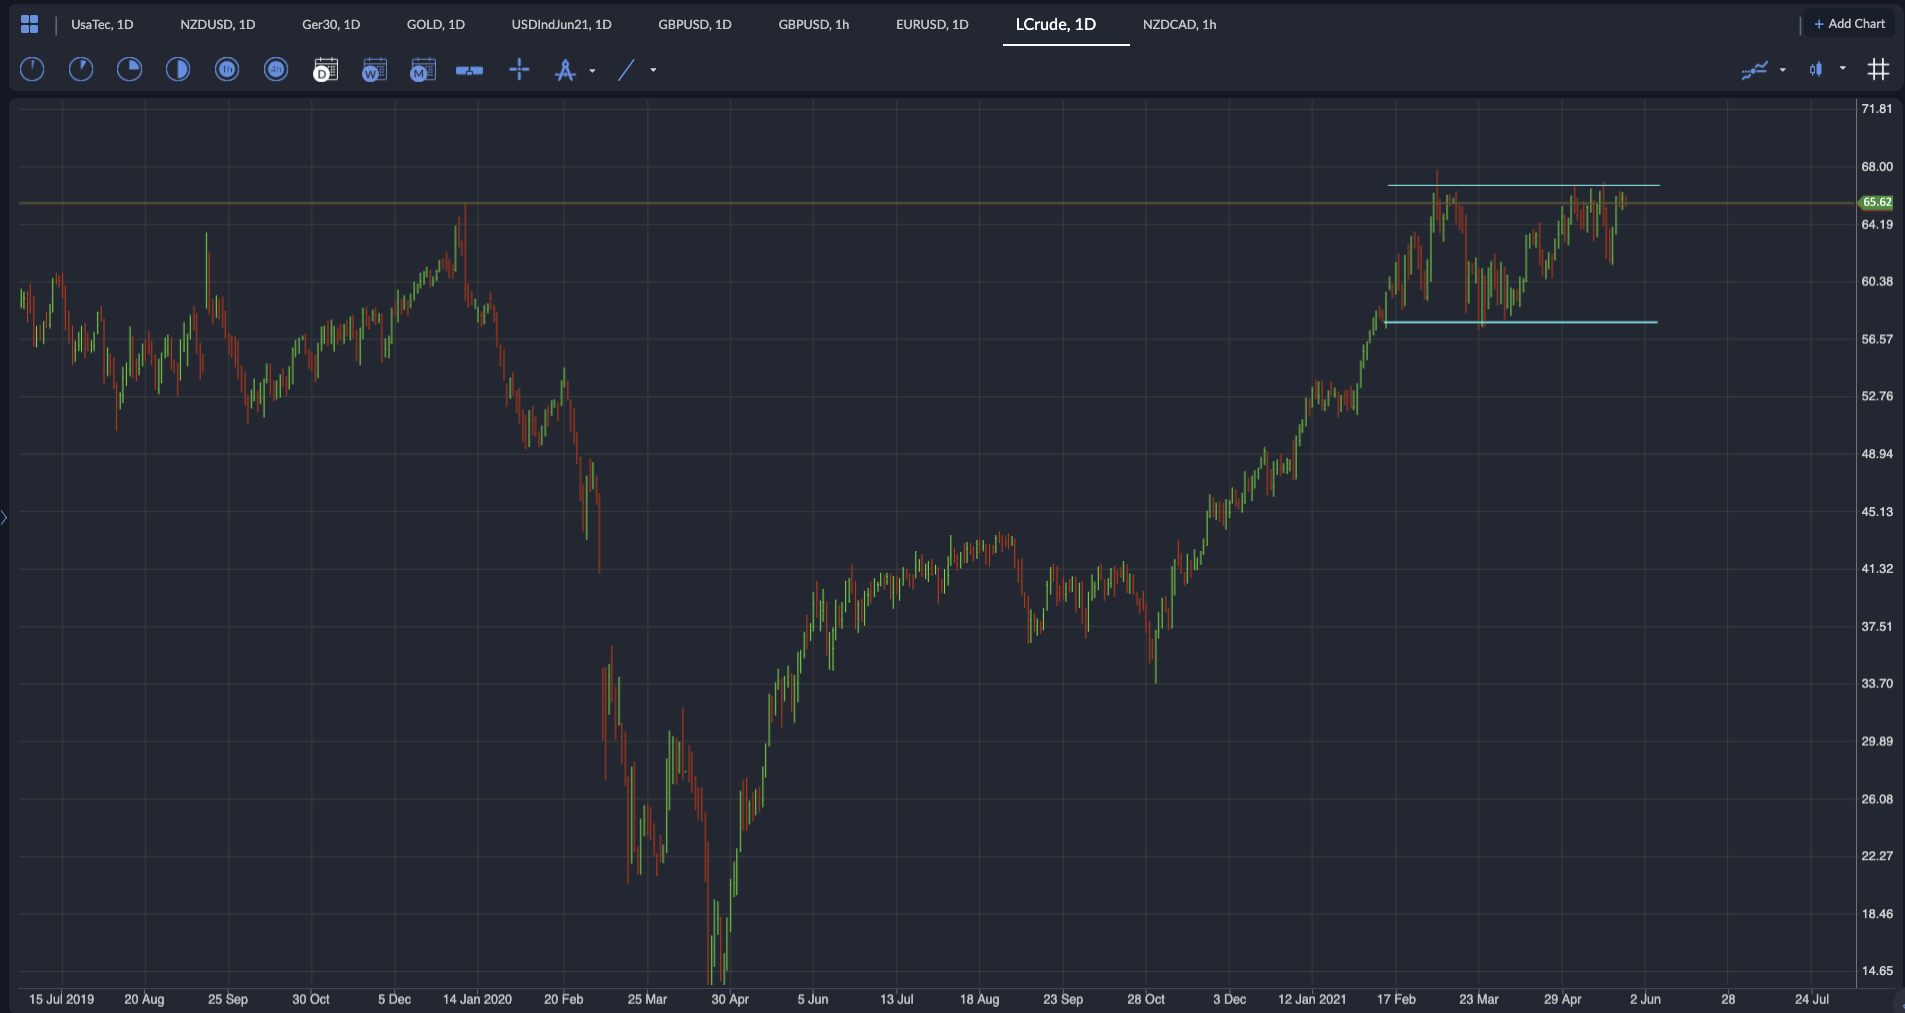
This Oil prices are trading range bound as investors are weighing signs of an improving demand outlook mostly in industrialised markets as countries accelerate their vaccine rollouts and economic re-openings occur as the most vulnerable are inoculated. A significant ramp-up in global oil demand over the summer is a seasonal phenomenon due to increased driving activity as people go on holiday. But there should be that extra boost from the increased economic activity too.
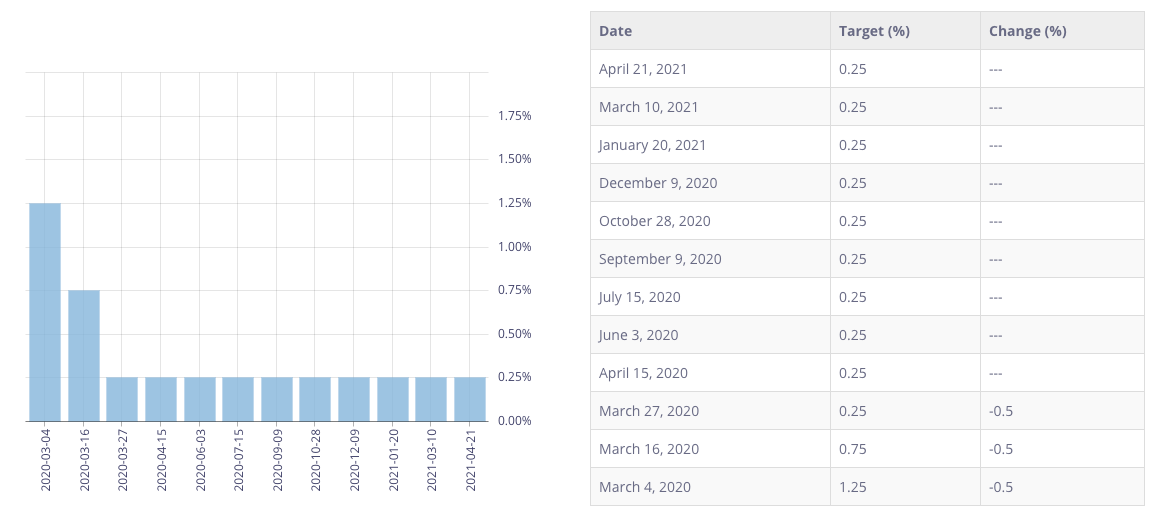
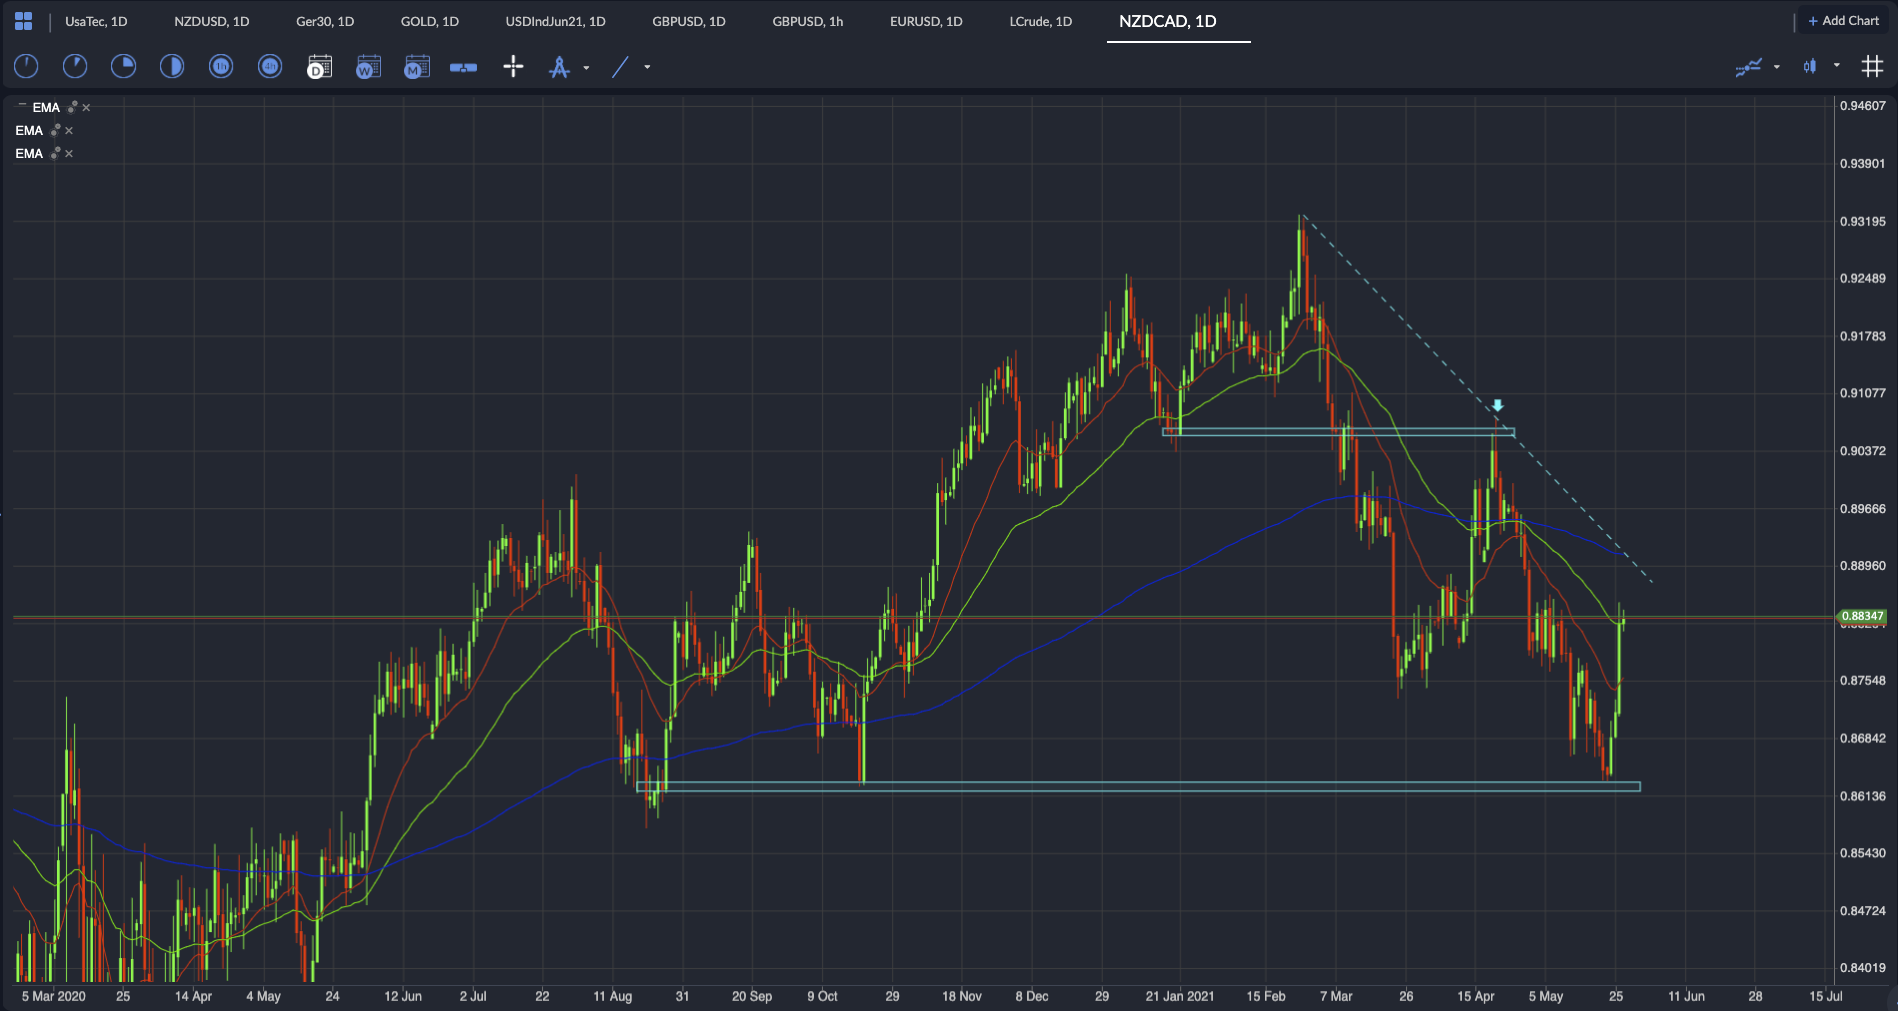
Since the pandemic, the price of Oil has returned from the extreme lows where they literally went negative back to pre-pandemic levels, making a near perfect V shape bottom. This recovery has kept the Canadian dollar strong as Canada’s economy has a high correlation to the nominal price of oil. The Bank of Canada has not changed policy recently and the overnight rate has been pinned to 0.27% since March 2020, with their next opportunity to make forward guidance in the second week of June.
If the extra barrels of Oil do emerge from Iran but global demand and OPEC+ can absorb these without tipping the Supply/Demand over to over-supply, there is a likelyhood that the inflationary pressures seen in the headline CPI data from Canada could push the central bank to start a rate hike cycle.
The likelihood that the Bank of Canada would move before the Federal Reserve is slim, but we are hearing more hawkish tones from these central banks which is leading economists to predict rate hike cycles in 2022. This week we learned from the RBNZ that they were seeing improvements in the economy, and they took the market by surprise with their more hawkish stance. Though the ANZ Bank had forecast that the RBNZ would begin hiking rates in August 2022, and gradually lift the OCR to 1.25% by end-2023.
See real-time quotes provided by our partner.
The NZDCAD had been in a decline for the most part of the year so far and back in late April the pair found resistance at a previous market structure swing low and proceeded to trade below the daily 200 ema. Yesterday’s bullish move across the New Zealand dollar crosses boosted the NZDCAD back above the 0.8800 level and a technical close at the daily 50 ema.
The ActivTrader sentiment indicator is extremely bearish with 95% of traders shorting the pair, which is understandable given the exponential rise is the Oil price and strength of the Canadian dollar. If the NZDCAD can get back above the daily 200 ema, the next form of resistance is a sloping trend line from the previous weekly swing highs this year. A close above there would surely signal that these retail short sellers are on the wrong side of the trade and that is where we could get an acceleration higher as they buy back their positions.
See real-time quotes provided by our partner.
On an hourly chart, the current price action is trading withing a previous consolidation range formed at the beginning of May. A close above 0.8860 would signal that volume area of resistance would be cleared, leaving the momentum as shown by the ema’s on this shorter time frame to signal a continuation higher. While the 20, 50 and 200 period ema’s are stacked on top of each other, traders could capitalise on the bullish momentum by buying the dips, but equally, breakout trades could prove to be profitable as aggressive moves are likely as we start to trip stops.