Market Brief
The Caixin China General Manufacturing PMI continued its growth in May rising to 52.0 from 51.9 in April. New orders rose the most since December 2020 as the index rose for the 13th consecutive month. “Average cost burdens rose rapidly in the latest survey period, with the rate of inflation the quickest since December 2016. Panel members frequently mentioned that higher raw material costs pushed up expenses. Firms generally passed on greater input costs to clients by raising their output prices which increased at the fastest rate since February 2011,” the report stated.
See real-time quotes provided by our partner.
The USDCNH on the 4h chart shows the extent of the downtrend with the Ichimoku cloud offering resistance up at 6.4 which is confluent with the previous market structure formed on the 10th of May.
The Reserve Bank of Australia (RBA) Governor Philip Lowe said the bank had kept the cash rate at a record low of 0.1% during its June meeting. The RBA are committed to using a loose, highly supportive monetary policy until at least 2024. The board said that it predicts GDP to grow by 4.75 % this year and 3.5% in 2022, supported by fiscal measures and very accommodative financial conditions. The bank also stated unemployment had decreased to 5.5% in April and is projected to fall to 5% by the end of the year. CPI inflation is anticipated to rise temporarily to be above 3% in the June quarter because of the reversal of some COVID-19-related price reductions.
See real-time quotes provided by our partner.
The AUDUSD has been travelling sideways for a long time now, with the ranges getting smaller as can be seen on the 4h chart. A break above the 0.7890 swing high that printed on the 10th of May would be a good signal that the sentiment and momentum had changed and would no doubt be dependent on the US dollar index falling a lot lower. Otherwise, if we were to breakdown, there is a growing consensus that the chart pattern is more like a head and shoulders distribution, and we could see a measured move down towards 0.7000 and back inside the daily Ichimoku cloud.
The Japanese Jibun Bank Flash Manufacturing PMI Index was revised higher to 53.0 in May, rising above the preliminary estimate of 52.5 and compared with 53.6 in the previous month. Both output and new orders grew at a slower rate. The IHS Markit stated “Japanese goods producers remained optimistic in the year ahead outlook for activity. Firms were hopeful that the pandemic would subside and induce a broad recovery in demand across the sector. IHS Markit estimates that industrial production will rise by 8.8% in 2021,”
During the European session, the market receives EU HICP Flash data along with the EU Unemployment rate along with the UK Final Manufacturing PMI reading for May.
See real-time quotes provided by our partner.
The USDJPY is also moving sideways which reflects the weakening US dollar and a weaker Japanese yen. However, my base case scenario is for the USDJPY to test higher after finding support at the moving averages again. In the US session the Tier 1 data is focused on the ISM and Markit Manufacturing readings for May with the PMI data expected to stay generally unchanged.
Today in the oil markets the JMMC/OPEC+ meeting begins.
See real-time quotes provided by our partner.
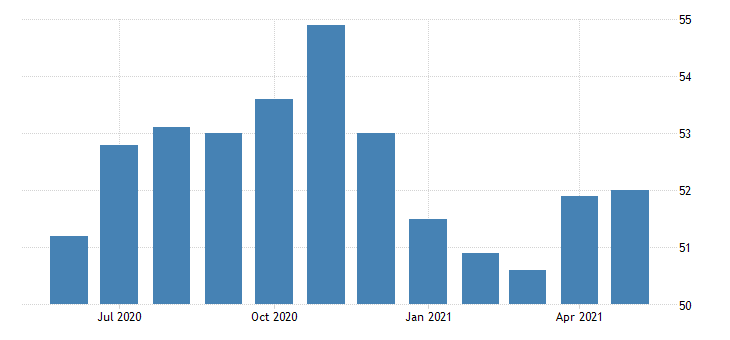
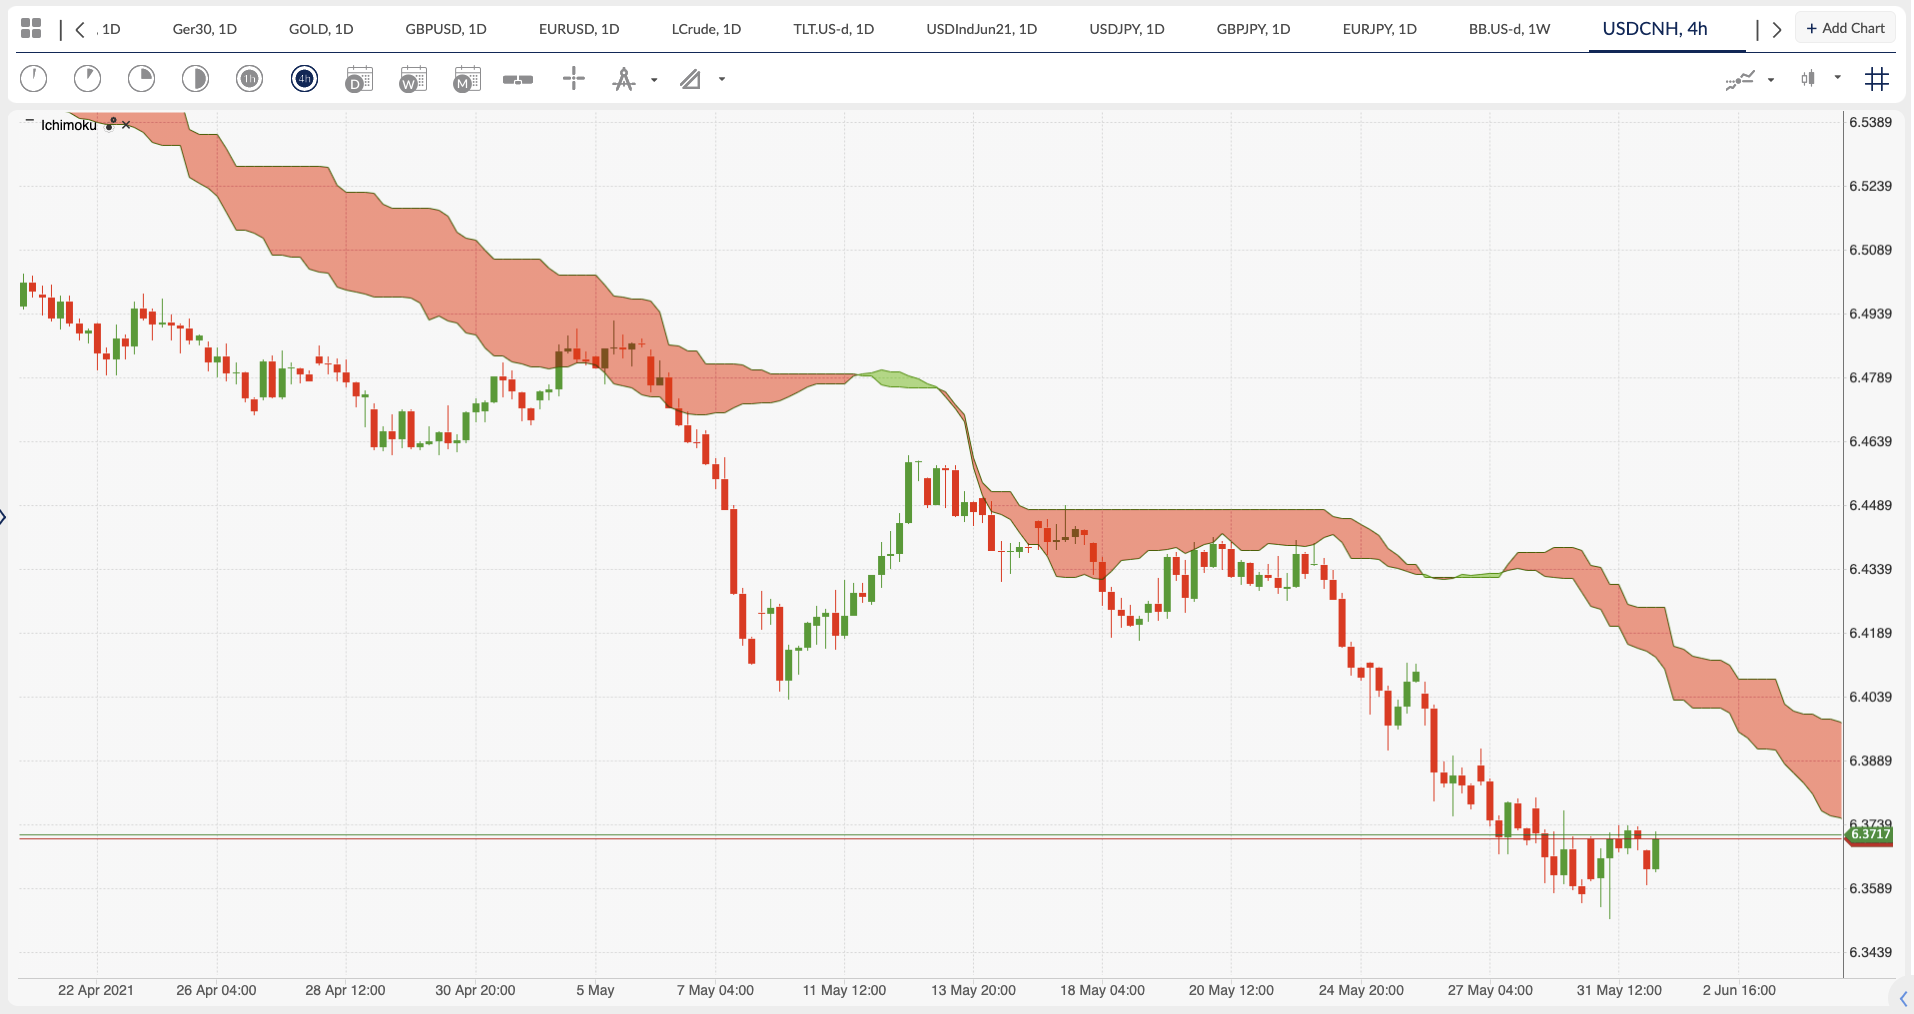
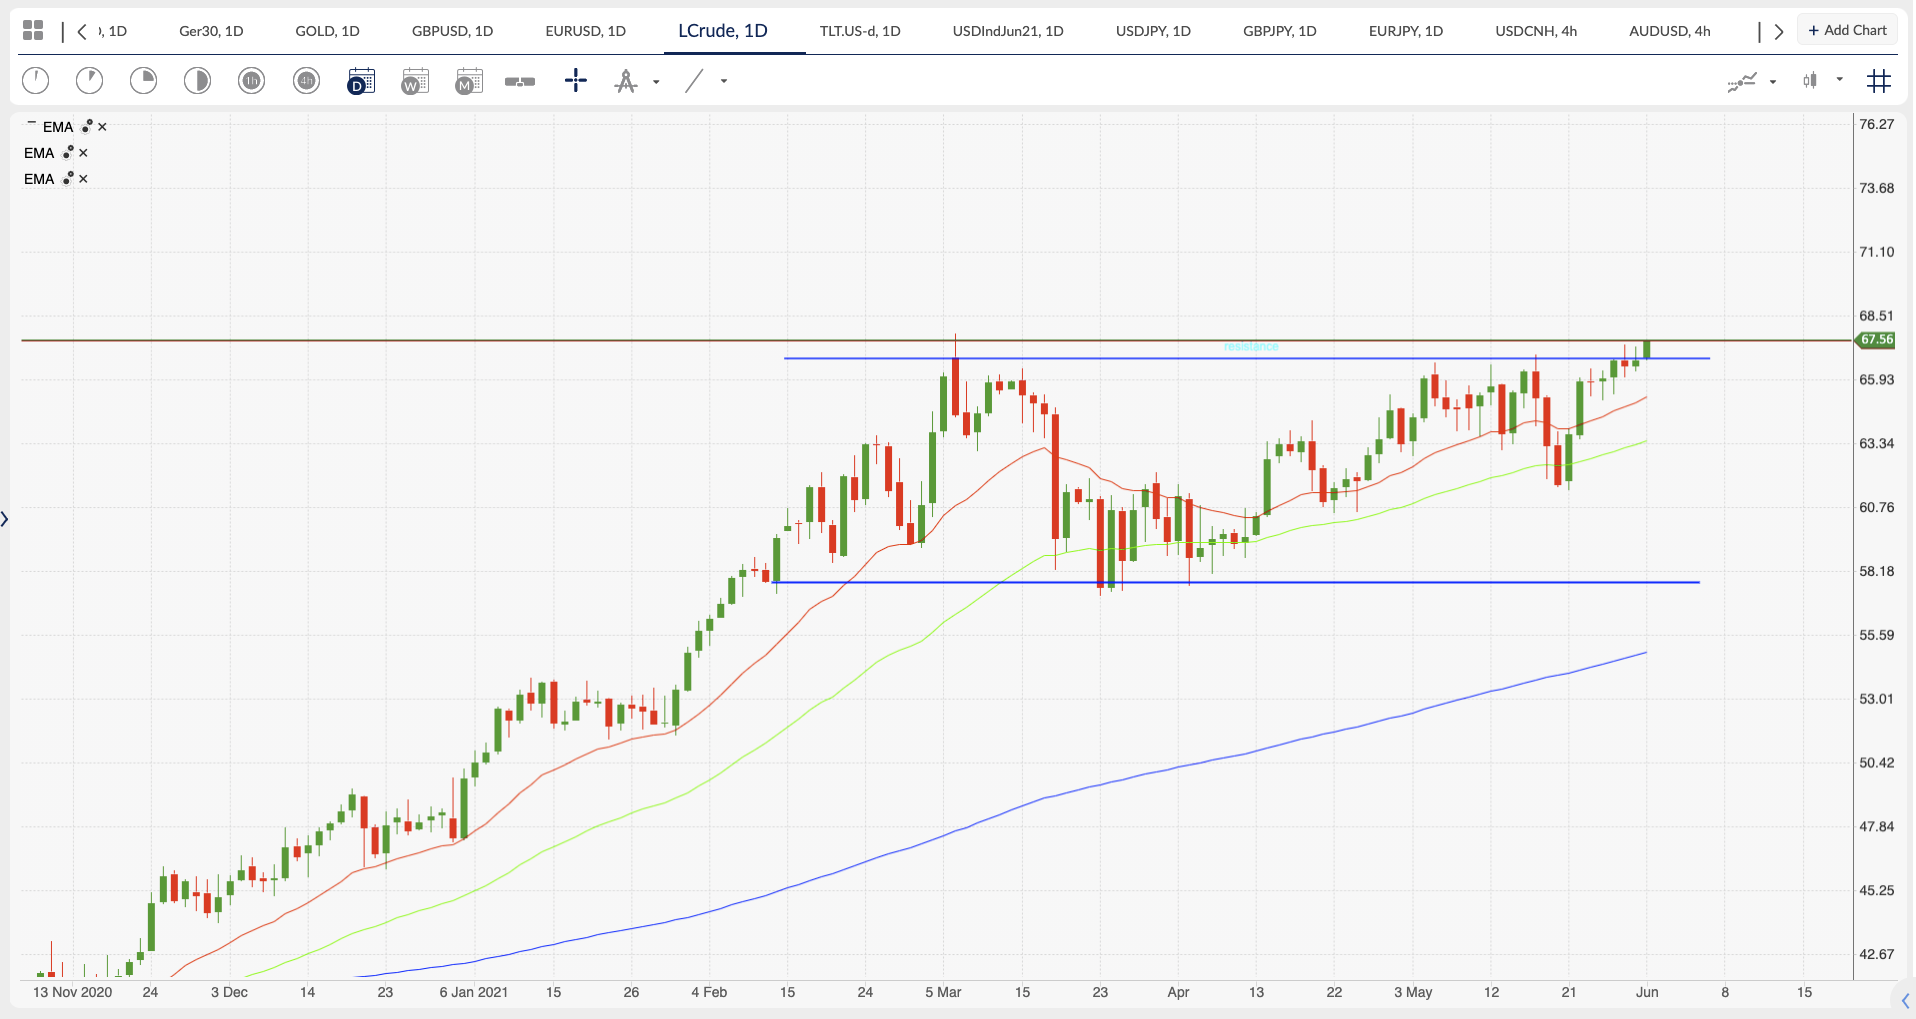
The WTI chart pattern has been a range bound market for a few months now, but today’s price action looks to be attempting a solid breakout. If the price of oil were to trade into a new range, we could be seeing prices up to $77, which would add inflationary pressures to the markets. A continued rise would be dependent on the global economies increasing demand and absorbing the new inventory from OPEC+ and Iran output cuts are reduced, and sanctions are lifted. The unemployment data in the US could be signalling that all is not well in their economy which would pertain to a weaker demand and a rejection of higher oil prices. There is also still a supply chain issue globally caused by the coronavirus, so no guarantees that oil rises from here. To the downside, if prices look above the range and then close back inside, this could signal to the bears that the bulls do not have enough energy to take it higher and they could apply pressure and target the rising daily 200 ema.