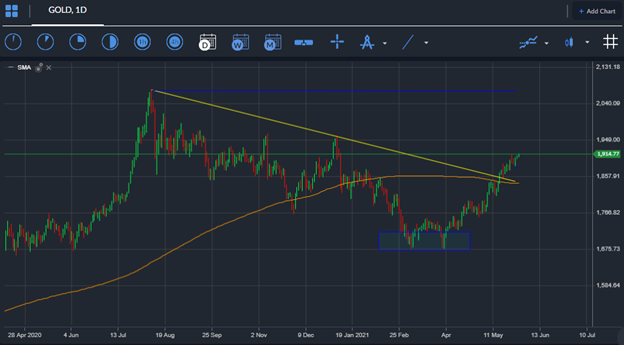
The price of gold is set for an important week ahead as the yellow metal appears to be on the cusp of a major technical breakout and dip-buying demand is still incredibly strong despite the metals recent recovery. In fact, gold is about to turn positive on the year in terms of performance.
Gold appears to be forming an inverse relationship with the US dollar index, meaning that when the US dollar index is firming the price of gold weakens, while when the US dollar is falling the price of gold is appreciating.
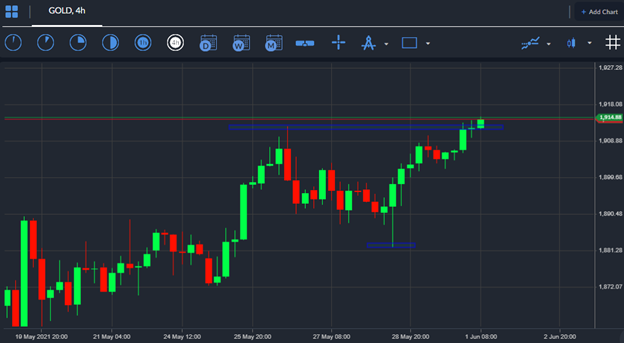
Last Friday’s price drop towards $1,880 was quickly scooped up by traders, meaning they could be expecting higher prices still for the yellow metal. Fibonacci analysis could be issuing a clue as to the possible price path ahead.
According to Fibonacci extension analysis the $2,007 level is a possible upside target for gold if bulls can overcome the $1,912 resistance barrier this week or indeed this month.
Gold has been following Fibonacci extension analysis remarkably well over recent weeks. The Fibonacci extension sequence I have been watching is the March 2021 swing high to the April 2021 swing low.
If the 100 percent Fibonacci extension target of $1,912 is broken then I am expecting a powerful breakout towards the 1.161 Fibonacci extension target, at $2,007. If bulls fail to form a breakout gold could be sold back down towards the $1,850 area.
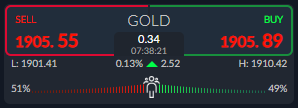
Current sentiment metric towards gold suggest that traders are unsure about the direction of gold. The ActivTrader Market Sentiment tool shows that some 51 percent of traders are negative towards the yellow metal right now.
Typically, neutral conditions hint at range bound trading conditions, meaning that the price of gold may not be ready to rally towards $2,000 just yet, although a breakout cannot be discounted given that gold has already broken $1,912 on the first day of June already.


