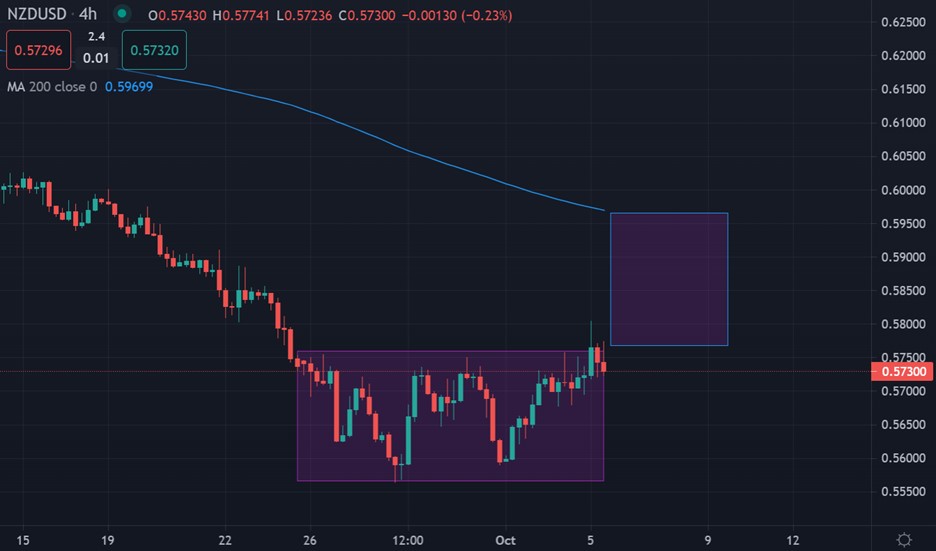
The New Zealand dollar is on the rise after the RBNZ central bank of hiked interest rates again earlier today, sending the NZDUSD pair sharply higher above the 0.5700 resistance level.
This marked the fifth 50 basis point rate hike in a row from the Reserve Bank of New Zealand. The Bank said it was considering a 75bp rate hike, which is quite the contrast with the timid RBA this week who settled on a 25bp rate hike.
Aside from NZDUSD, I would suggest that cross strength could come into play with AUDNZD weakening. This could help charge the New Zealand dollar against other major currencies.
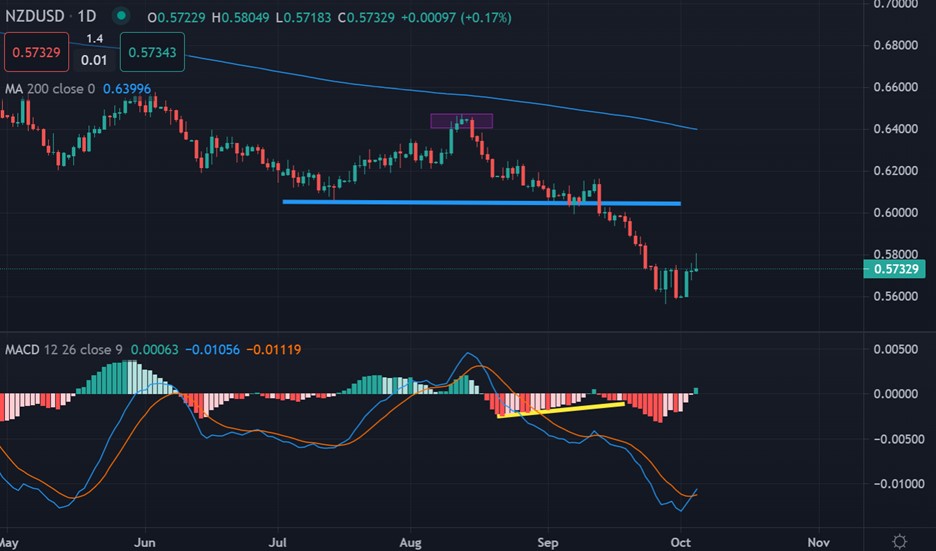
Technically, I think the charts are alluding to a potential price run towards the 0.5900 resistance zone. A break above the 0.5750 level should help cement further price gains ahead.
Overall, the NZDUSD pair is showing tentative signs of a price bottom. However, we really need to see the US dollar index topping out, with sure confirmation before we get too excited.
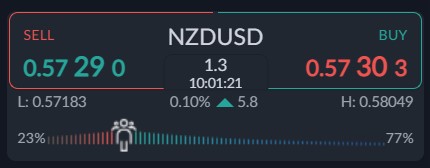
According to the ActivTrader market sentiment tool some 77 percent of traders are bullish towards the NZDUSD pair. As we typically look to fade sentiment biases, this could mean the NZDUSD pair could start to reverse lower.
It is worth mentioning that high levels of bullish sentiment suggest a classic contrarian sentiment trade is still in the making, so do be careful buying this pair at current level, especially since the recent rejection from the 0.5700 area.


