Market Brief
Germany’s seven-day COVID-19 incidence rate reached the 11th record in a row as the daily jump in Coronavirus cases reached its highest level since the beginning of the pandemic.
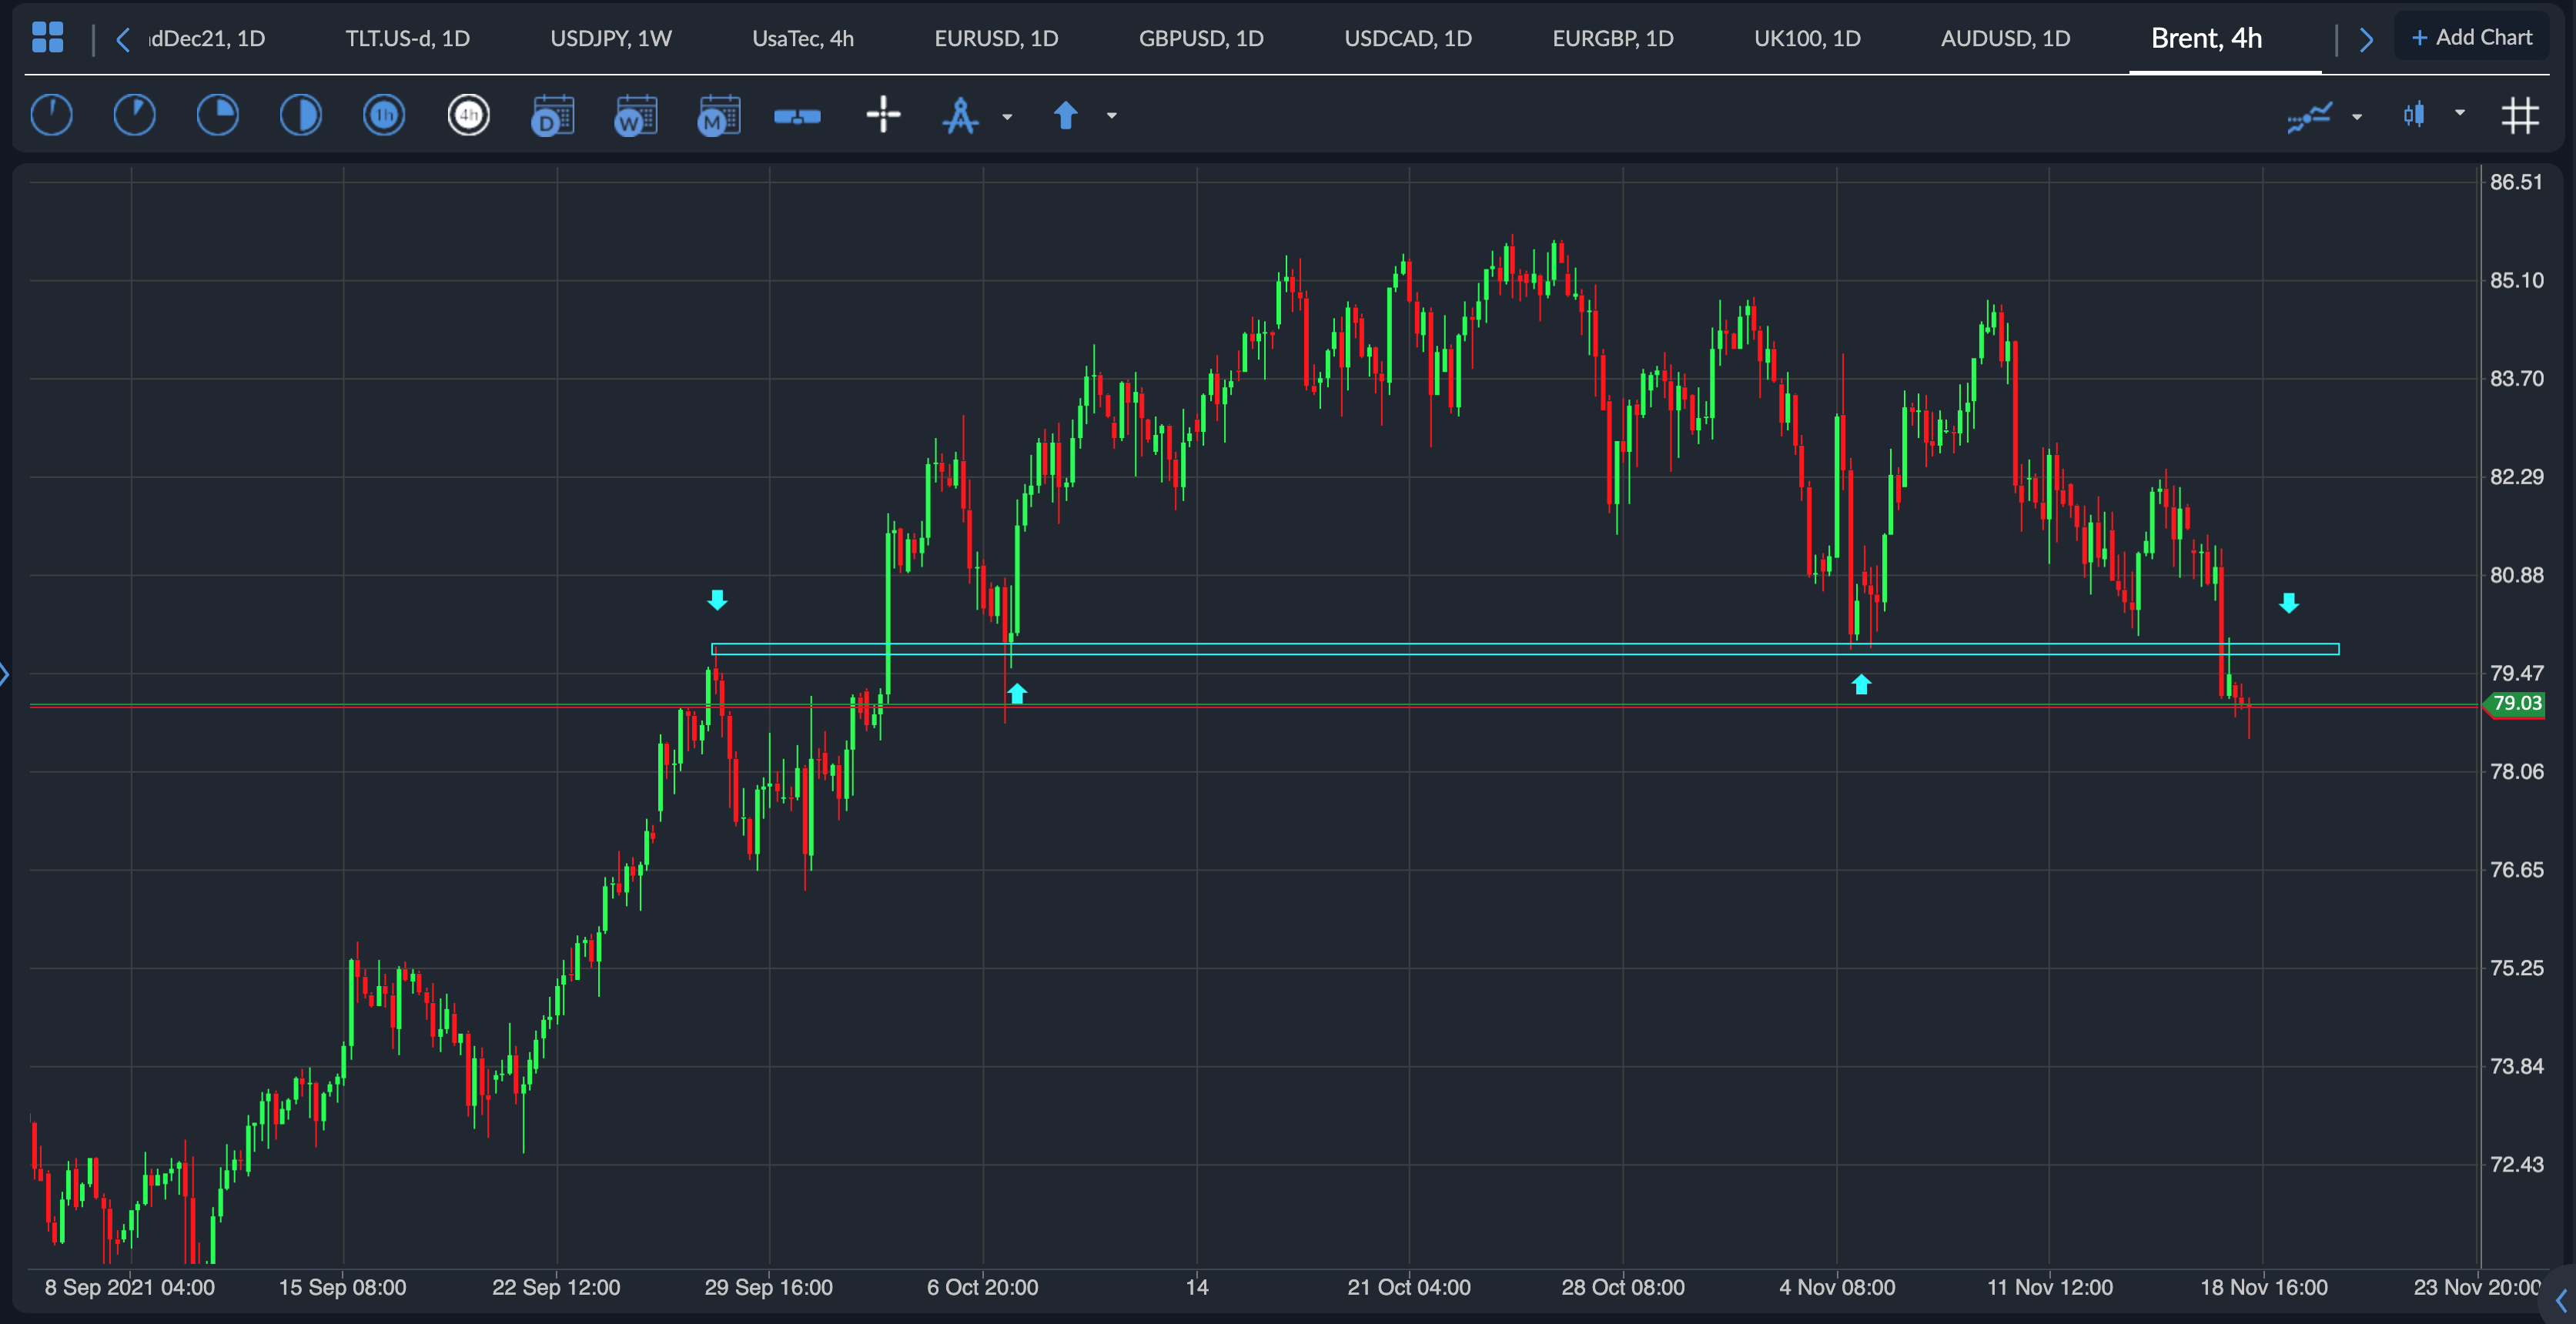
In the past day, 65,371 people tested positive for the virus, resulting in 336.9 cases per 100,000 people, according to the Robert Koch Institute (RKI). A further 264 deaths brought total fatality to 98,538, while the nation’s death toll reached 5,195,321. The rising cases of Covid-19 and its variants across Europe is starting to worry neighbouring nations as the Northern Hemisphere goes into Winter and the Flu season. Lockdowns are being considered and this will put a dent into economic growth and demand for things like oil.
See real-time quotes provided by our partner.
Oil futures prices on Wednesday declined on the COVID-19 concerns but also after President Joe Biden asked the Federal Trade Commission to investigate surging gas prices and how companies set them. During the overnight session the price of Brent tested the old support level and found it to be resistance. So in today’s London session I am expecting further declines.
While the European Central Bank watch on as German Bund real rates continue to fall and inflation rises, and the euro capitulates, traders on the ActivTrader platform become ever more bullish.
See real-time quotes provided by our partner.
If the traders are looking at the descending channel and thinking this is going to break to the upside some time, I feel the longer they stay bullish, the more likely price is to grind lower to squeeze them out. The stochastic indicator and the lower trend line are some sort of confluence, but equally, forex pairs can stay over sold for a very long time and just grind lower as well as higher. I cannot see any real catalyst for a surge in prices, other than a possibility of the US dollar collapse on an un-foreseen market shock.
See real-time quotes provided by our partner.
The pause in the euro ahead of Fridays multiple speeches from ECB President Lagarde may be one of the reasons why the US dollar index has stalled, but it is just as likely some profit taking too. Fridays close will be a key indicator of whether this is really the top in the DXY.
The forex heatmap is indicating that the NZDJPY may be the currency pair to trade today. But overall, the outlook is mixed across the G10 currencies, and we should be trading carefully as things are likely to get choppy.
Elliot wave is a good way to consider whether a market is in an impulsive mode or a corrective mode. Looking at the NZDJPY chart below and comparing the price action to the examples above, one could argue that there is some upside in the NZDJPY still to come.
Buying the NZDJPY off a weekly S/R level is also a great way to put the odds on your side.
See real-time quotes provided by our partner.
If the NZDJPY is a good indicator of how a higher yielding, risky, commodity forex pair is gaining on the safe have, Japanese yen. We can expect to see other risk assets gaining overall. The S&P500 is certainly looking like it could make new all-time highs as it pushes to break out of last week’s small range. Momentum is on the side of the bulls as can be seen in the moving averages. The MACD has also recently turned above the signal line and is indicating a bullish confirmation.