Forex Analysis – NZDUSD
A major part of being a trader is to plan a trade and then to trade the plan. Often when we look at the charts, we can with hindsight pick out some amazing trades, which would have netted 100’s if not 1000’s of pips. But when we are sat at the trading desk and looking at the intraday movements and seeing the intraday volatility, it is hard to pick which points in time and price would have resulted in the minimum amount of risk for the maximum amount of reward. If we do find ourselves in a great trade, not having an idea of where price may do a 180º about-turn, leads us to question whether we should hold or collapse the trade.
See real-time quotes provided by our partner.
Currently the NZDUSD daily time frame is in a corrective period, we can see this on the charts as the higher time frame price action is essentially drifting slightly lower and laterally across the chart. Not vertically. The price action is entwined with the 3 daily moving averages, showing a prolonged period of correction. However, on a macro view, the bottoming V-shape in March 2020 around 0.57000 is now 1300 pips away from the current price action. The chances of the NZDUSD being in an impulsive wave on a macro view is very high. Which means there is more upside potential than downside.
The ActivTrader sentiment indicator shows that traders are slightly more bearish than they are bullish, which reflects more traders going against the trend as the mainstream narrative is for the US dollar to rise due to higher levels of inflation and the Fed preparing to tighten their monetary policy. Very little is said of the RBNZ is the media so retail traders generally miss out on a holistic viewpoint. On the 24th of November the money markets are preparing for the RBNZ to raise interest rates by 25 basis points (bp), with a potential 50bp hike on the cards too. Like I said the recent weakness has been largely down to the US dollar appreciation but also New Zealand has been in a state of panic as COVID-19 caused the government to lockdown the islands.
See real-time quotes provided by our partner.
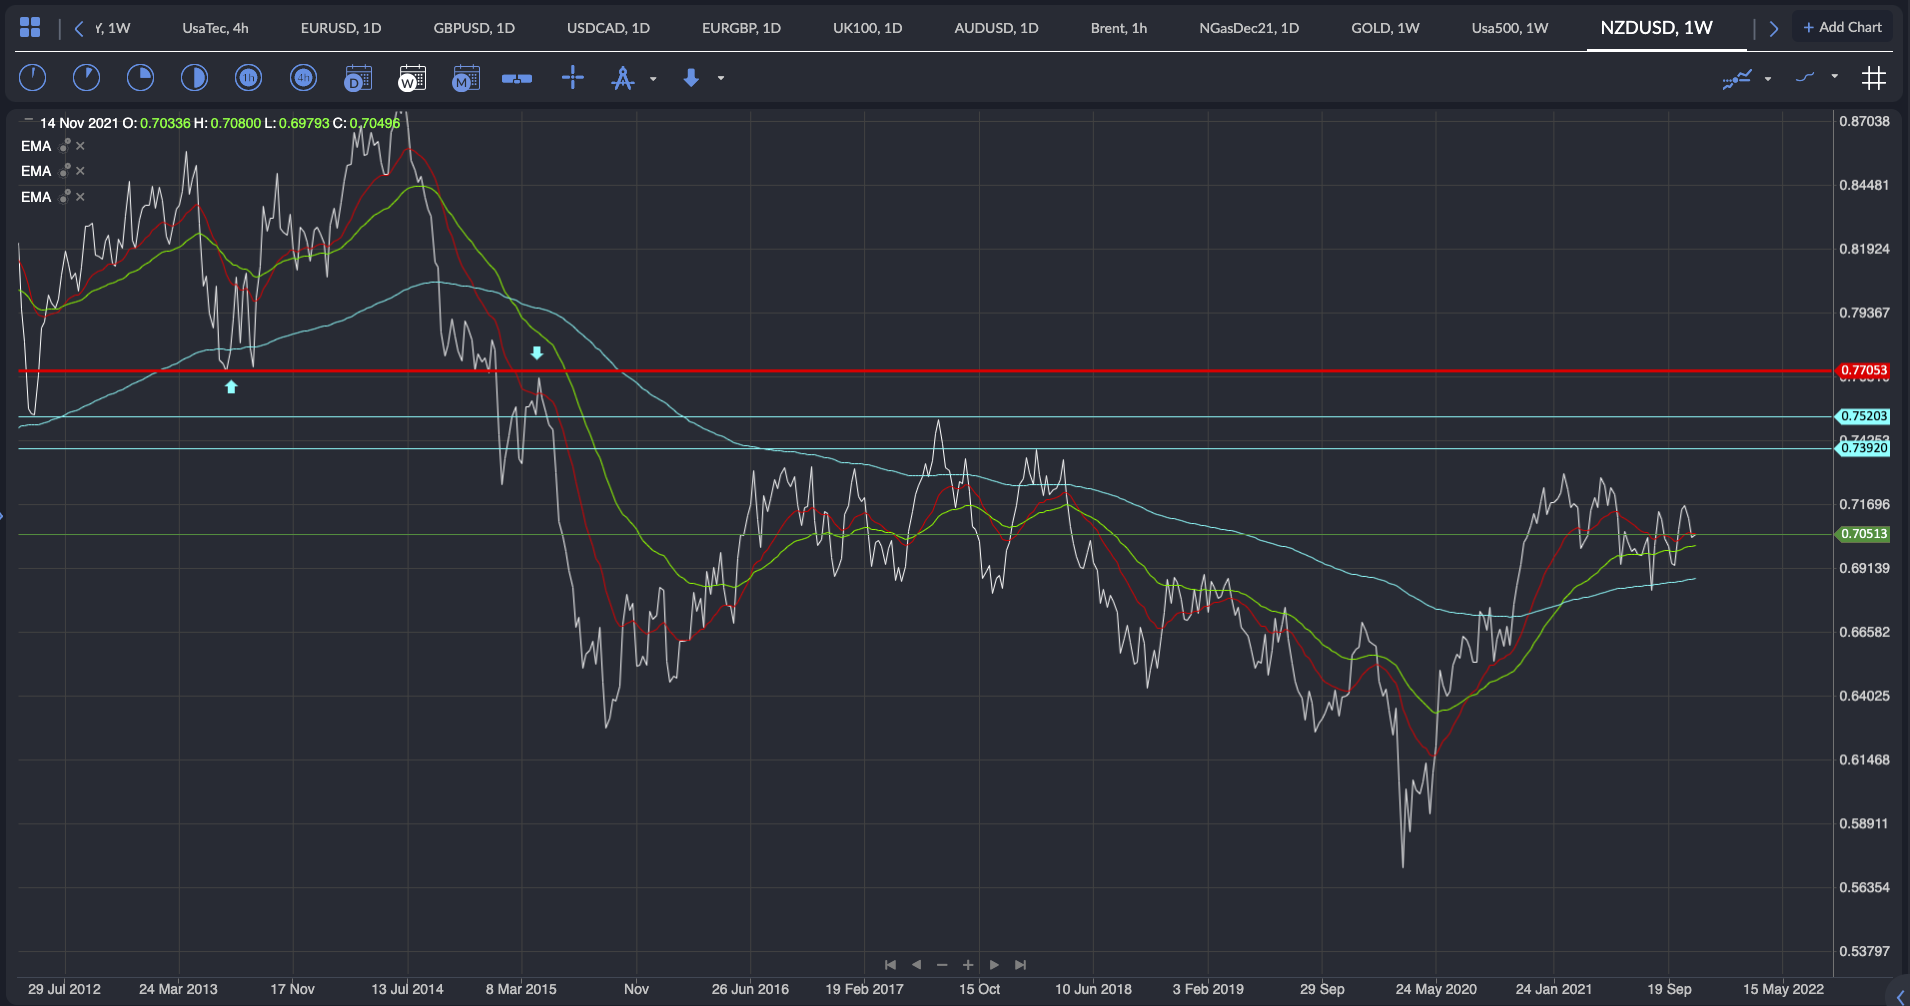
If we project forward in time an imagine what we would like to see should the RBNZ deliver a 50bp rate hike or signal that the 25bp is just the start of the rate hike cycle and that the RBNZ have a clear path to raising rates regularly to crush inflation, the markets would re-price the NZD higher. As the inevitable short retail short squeeze gathers pace, the targets would be just above some significant swing highs where traders who are short would have to buy back their position and those that are long would sell into them.
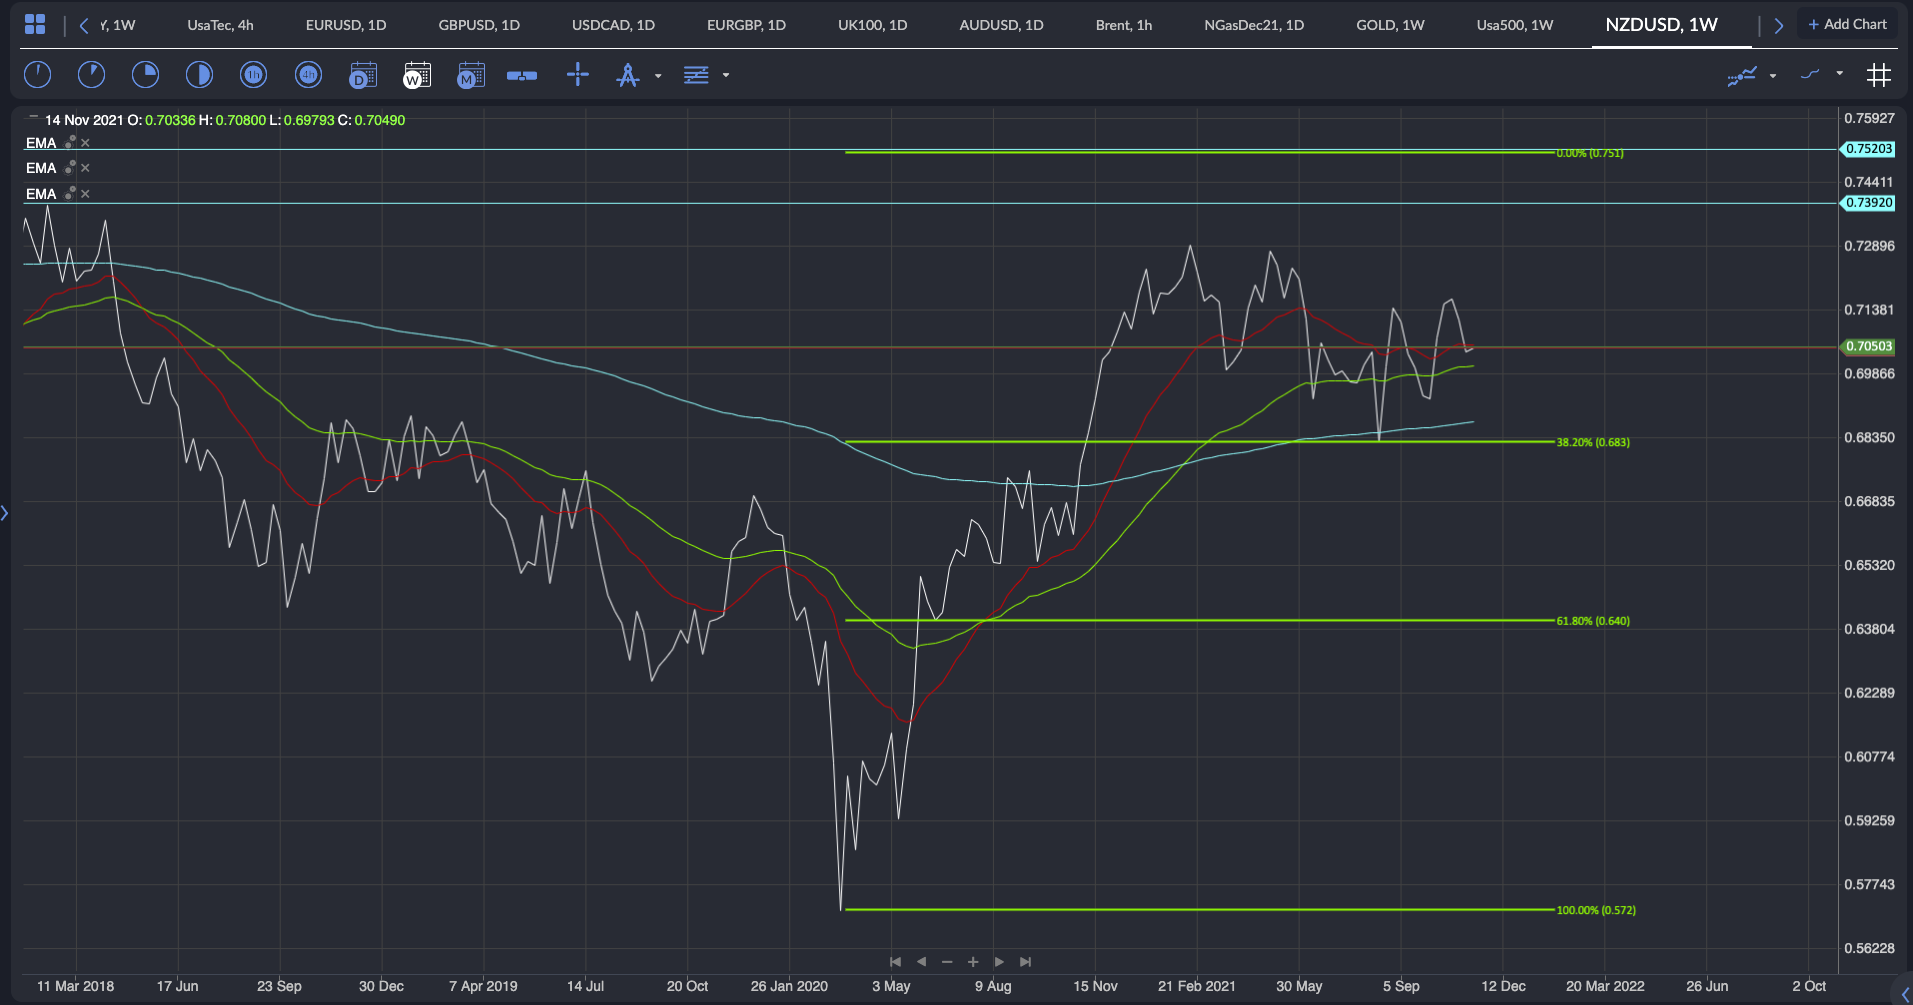
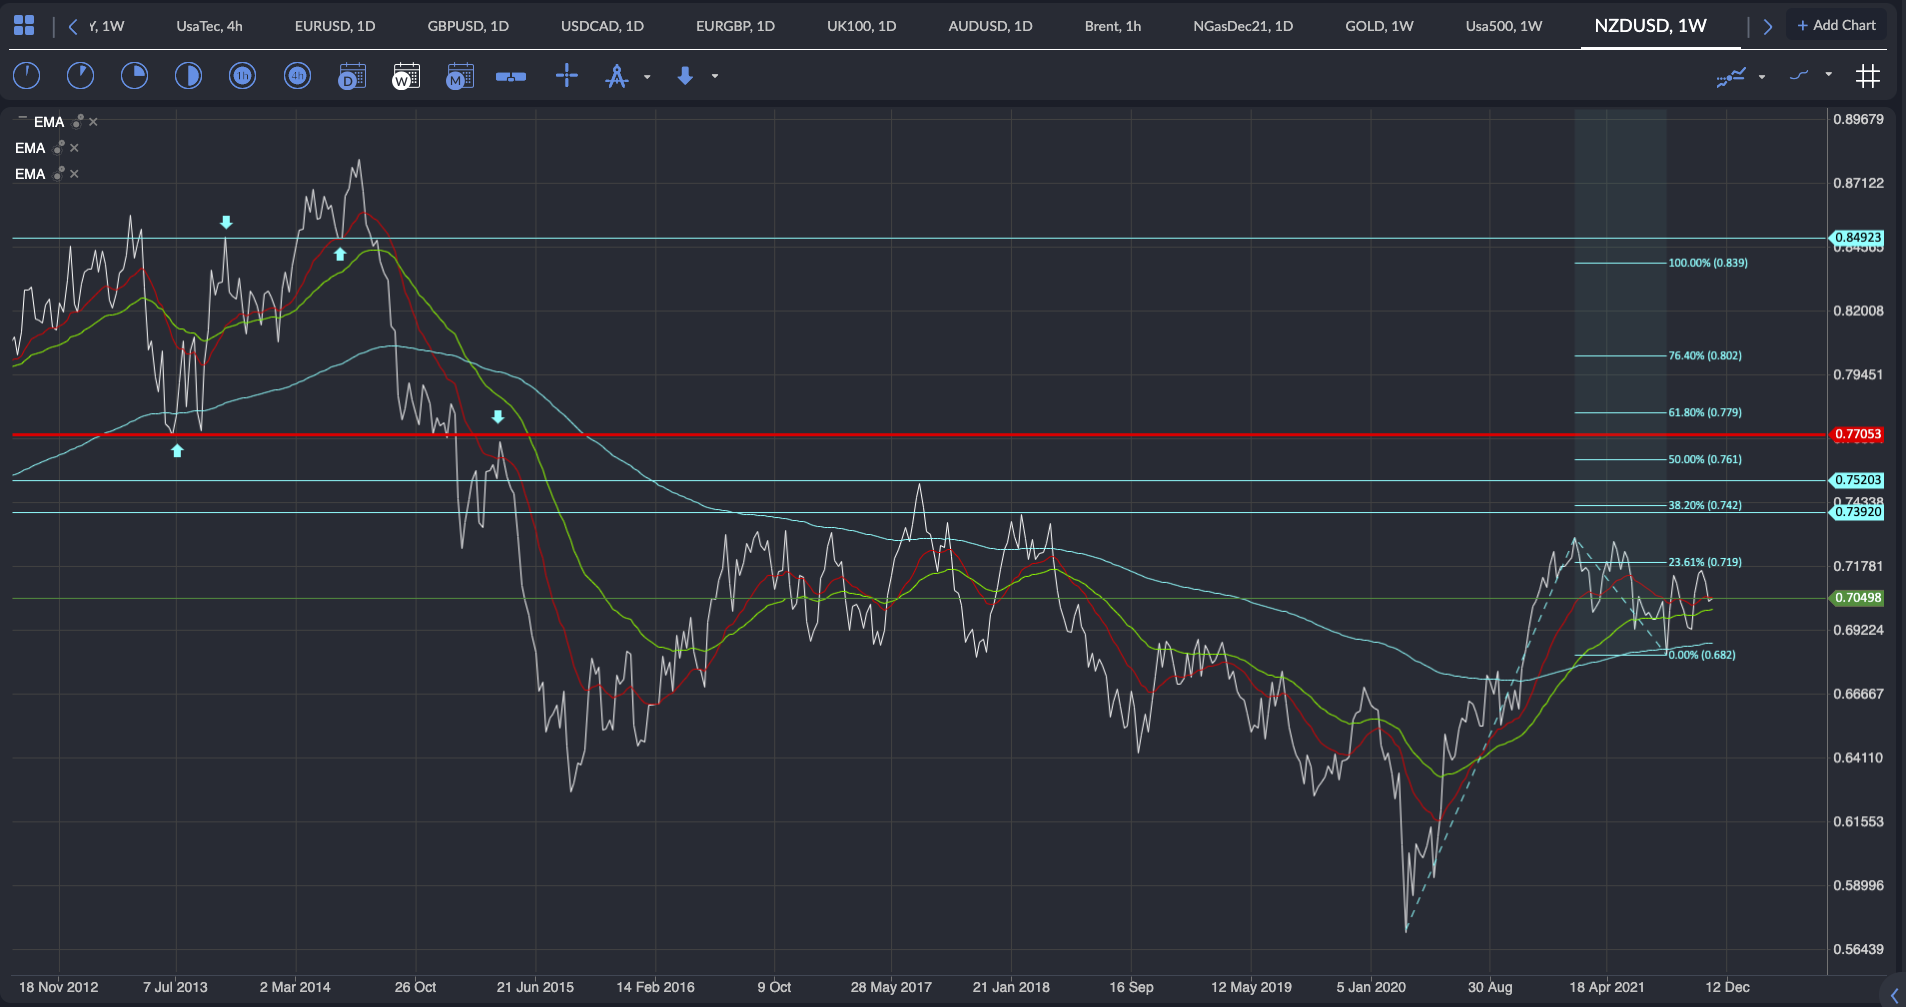
We would then look back at the charts when the NZDUSD hit 0.7520 and see how the current price action was a great bull flag set up in an impulsive wave higher.
See real-time quotes provided by our partner.
By expanding the chart data set we can identify other major levels of support and resistance which are just as likely to get tested in a bull move. If we can see them, all the banks can see them, and their clients can see them. So eventually they become self-fulfilling prophecies. Assuming the macroeconomics still supports an appreciating Kiwi. A lot can happen in a year as we all fond out in 2020.
See real-time quotes provided by our partner.
Ultimately, I am looking for the RBNZ to tighten their policy faster and harder than the Federal Reserve and this for me will be the catalyst for the NZDUSD to keep appreciating. With the significant swing highs acting as first targets and then acceleration points as more buyers add into any pullbacks as soe traders take profits or get stopped out. If the RBNZ do a Bank of England and disappoint with no rate hike, this all becomes very bearish for the Kiwi. Hence why we plan the trade and trade the plan. For a bearish scenario we would need a plan B.