Weekly commodity analysis
Purchasing power parity (PPP) is a macroeconomic analysis metric used to compare economic productivity and living standards between countries. According to PPP, different countries’ currencies are compared through a “basket of goods” approach. When a currency is trading above the PPP neutral line it is deemed to be overbought and given time, will revert towards the mean.
The USD versus the CAD currently has an exchange rate of 1.27053, which means 1 US dollar is equivalent to 1.27053 Canadian dollars. The calculated PPP for USDCAD is 1.21000 and this says that the US dollar has appreciated by 605 pips above the theoretical exchange rate.
By calculating PPPs, investors can predict how exchange rate fluctuations will affect the economy of a country, and therefore how their investments will be affected. This becomes more pertinent when the Central Banks begin to shift their monetary policy. In March we are expecting the US Federal Reserve (Fed) to lift the EFFR to 50bps. Though there is a chance that they will add 50bps to the current rate and take it up to a target of 0.75%.
If the Bank of Canada (BoC) doesn’t respond in kind, this could help push the divergence between the two currencies further. Currently, both the Fed and BoC rates are equivalent at a target of 0.25%. Towards the end of January 2022, the BoC governor Tiff Macklem announced that the Canadian economy no longer needs the banks to help fight the effects of the COVID-19 pandemic and confirmed that the policymakers will be raising rates soon.
The other reason for a monetary policy shift from both CB’s is due to the rising and persistently high inflation rates which began increasing soon after they bottomed in April 2020. In both countries, inflation is still rising and is above pre-pandemic averages.
See real-time quotes provided by our partner.
On a monthly chart of the USDCAD, the 1.21000 levels make more sense. It has historically been where the USDCAD found buyers and is the target for when the USD appreciates too far. Given that both CB’s are very likely to raise their interest rates, it seems also likely that the resulting interest rate hikes will cancel each other out. Moreover, since the USDCAD is above PPP, it would seem natural to short the currency pair. In terms of momentum, the USDCAD is above the monthly 200-period moving average reflecting the recent bull move in the US dollar, though quite clearly the USDCAD had been up there with the worst performers since the summer of 2020. In terms of closing prices, the USDCAD is below its 3-month closing price so we could be seeing resistance forming at this 1.27000 area.
See real-time quotes provided by our partner.
Zooming in to the recent price action and I have labelled up the significant resistance that occurred when the price initially broke out of a consolidation period back in the early autumn of 2020.
Can a strong currency increase the GDP of another country?
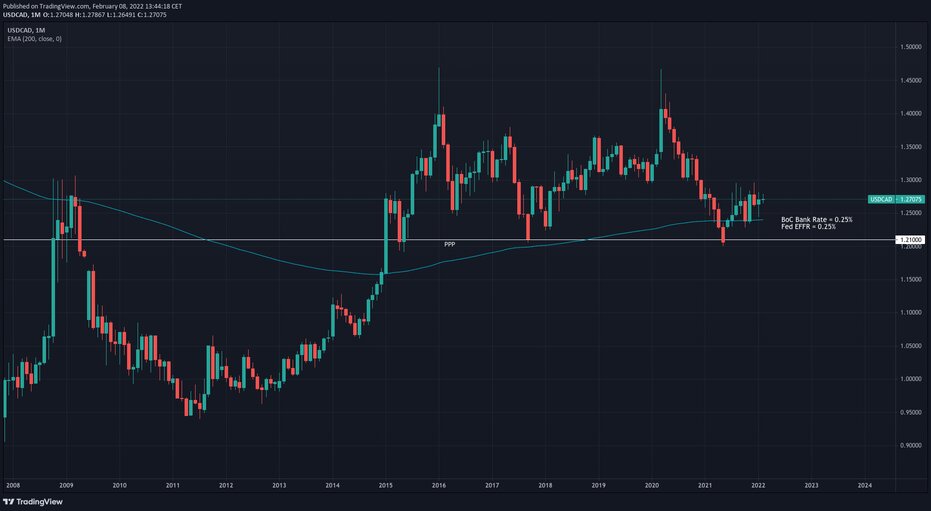
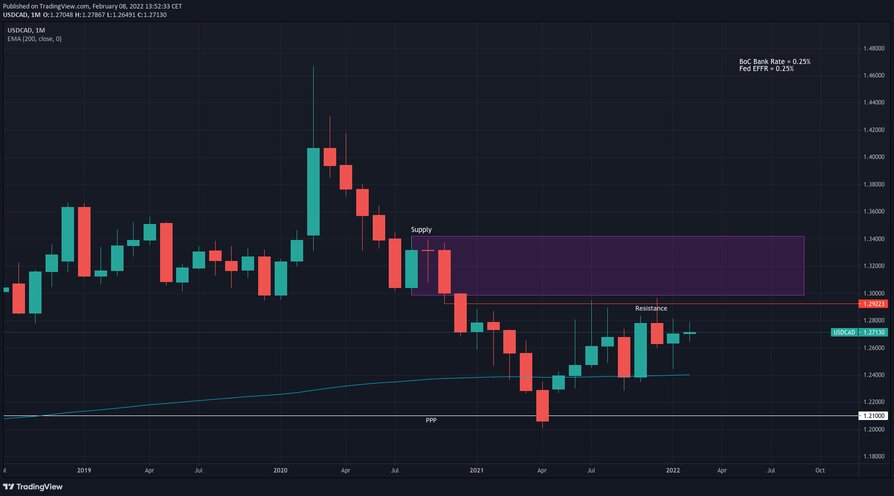
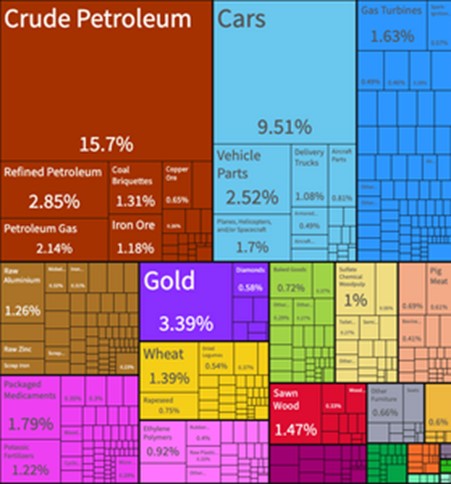
In the case of the USDCAD, a strong greenback can be used to import Canadian exports. According to The Observatory of Economic Complexity, Canada was the number 10 economy in 2019 and the number 11 world exporter. The top of Canadian exports is Crude Petroleum, with Cars, Gold and Refined Petroleum products mostly going to the United States.
A lot has happened in the last 2-years due to the pandemic not only shutting us all down but we’re also seeing the continuation of disruptions even after economies re-open. What can be assumed though is that the Canadian economy will be closely tied to the exports of Oil in the future.
With the third-largest oil reserves in the world, Canada is the world’s fifth-largest oil producer
4.6 million barrels per day of crude oil were produced by Canada in 2018; this makes the country a major source of safe, reliable crude oil for international markets. Furthermore, Canada holds one of the world’s largest oil reserves, surpassed only by Saudi Arabia and Venezuela. The country has 168 billion barrels of proven oil reserves, of which 164 billion barrels are oil sands. In 2018. 96% of Canadian crude oil exports went to the USA.
Canadian oil is different from that found in Texas or the Gulf of Mexico. A natural mixture of sand, clay or other minerals, water, and bitumen is referred to as oil sand. Two methods can be used to extract bitumen, depending on the depth of the deposits below the surface. But the key takeaway is that there is more processing needed with this oil sand, which means that it’s also more expensive to produce. Therefore, it is probably in the Canadian oil industries best interest to have the US dollar stronger than the Canadian dollar to give them the incentive to buy and to keep the margins reasonable for Canadian producers.
See real-time quotes provided by our partner.
WTI and Brent oil contracts generally move in lockstep as any inefficiencies are arbitrage traded out. What the above chart shows is that the WTI (LCrude) contract has possibly overshot to the upside and found technical resistance from an ascending channel upper bound. This could be a great place for traders who have been long for a considerable amount of time to take some profits. They may have even squeezed out the last few percent on the back of the rising geopolitical situation around the Ukraine. The reason being given for a softening of the oil price today is the talks between Washington and Tehran which could lead to an agreement on Iran’s nuclear aspirations and a removal of sanctions imposed on them which inhibits the sale of oil to the world.
See real-time quotes provided by our partner.
Traders looking back out nearly a decade will also have noticed that there had been some equal lows acting as support in 2014 at these elevated levels. They are now potentially significant resistance and would have been a target for anyone long to take profits at.
See real-time quotes provided by our partner.
If the price of WTI cannot close higher today, the price action tomorrow will be crucial to the following move. A weaker oil market today will signal those traders are genuinely more concerned about increasing supply versus demand, than possible WW3 between Russia and the West. Whether or not either will happen is very doubtful in 2022, if ever, but the sentiment change would be obvious. A 20% correction would bring the oil price back down towards more reasonable levels that would go some way to reducing global inflation. I personally feel that any correction would more than likely stall out just below $80 but if we got there in a short space of time, there could easily be an overshoot of the mark towards $70.
The moving averages also show that dynamic support from the 20 and 50-period daily EMAs would come in around the mid-$80 levels. With the 200 EMA currently down at $73.
The best way to trade this currently is to wait for a pullback into support and a buy the dip opportunity. If the fundamentals do shift in favour of increased supply, then the next idea is to wait for a bearish market structure to form and to short, lower highs and lower low breakouts.