The Nasdaq had one of its worst daily sell-offs of the year so far this week after the US CPI report poured cold water on the notion that the inflationary pressure in the US is starting to ease.
A natural casualty of a reversal in risk-on trades, the Nasdaq fell by nearly 5 percent intraday after the US CPI report caused traders to reassess their positioning this month.
With the odds of more aggressive rate action high it is probable that we are going to see yet more downside in the Nasdaq. The next bearish catalyst could be the Fed rate decision next week.
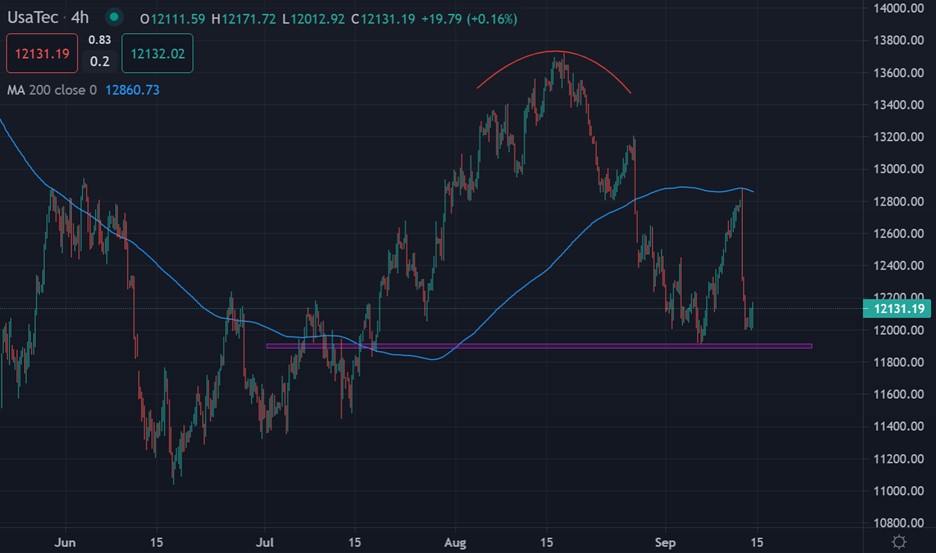
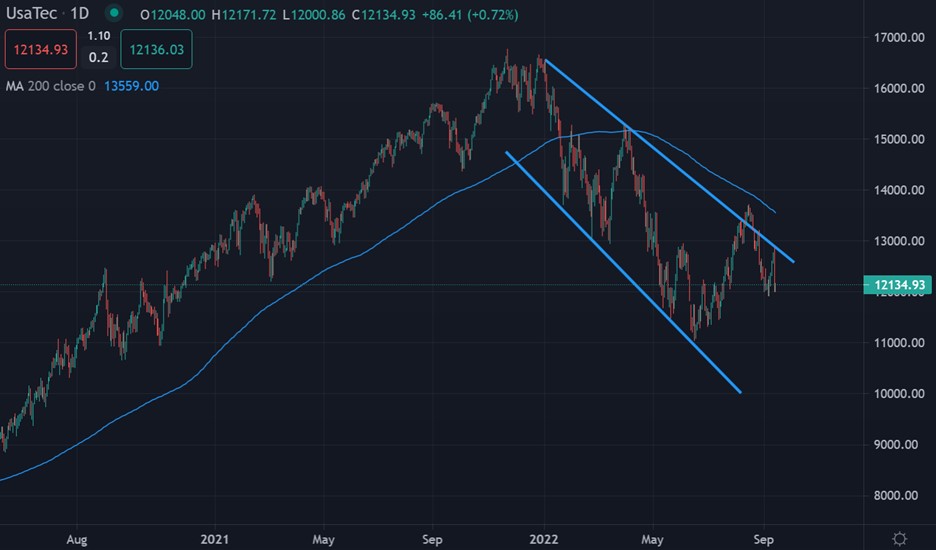
The technical are pointing for a move towards 10,000. This may surprise bulls, as traders have been scooping up dips. But with more rate hikes, selling rallies now seems more plausible.
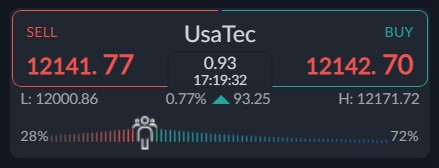
Traders sentiment towards the Nasdaq is still very bullish, which could hint at more downside as the retail crowd is not yet overheated on the bullish side, which is worrying.
According to the ActivTrader market sentiment tool only 72% are bullish towards the index. Based on this sentiment reading I think we could see more selling towards the leading US Tech index continue over the coming days.


