Gold had a huge week last week after weeks of selling pressure for the yellow metal finally came to an end as the Fed hinted that the pace of recent rate hikes may finally be slowing down.
Much of the action in stocks will depend on how the market reacts to the Manufacturing and Jobs data from the United States economy next week. Remember that bad news is good news for pressure metals.
Gold traders also need to keep an eye on the OPEC meeting scheduled for August 3rd, this week. This could be very impactful for commodity prices if oil output is somehow increased.
If we see OPEC upping production, it will please the market as oil prices could fall sharply. Such a move would likely cause the US dollar to sell-off aggressively and the bid-tone in gold to continue.
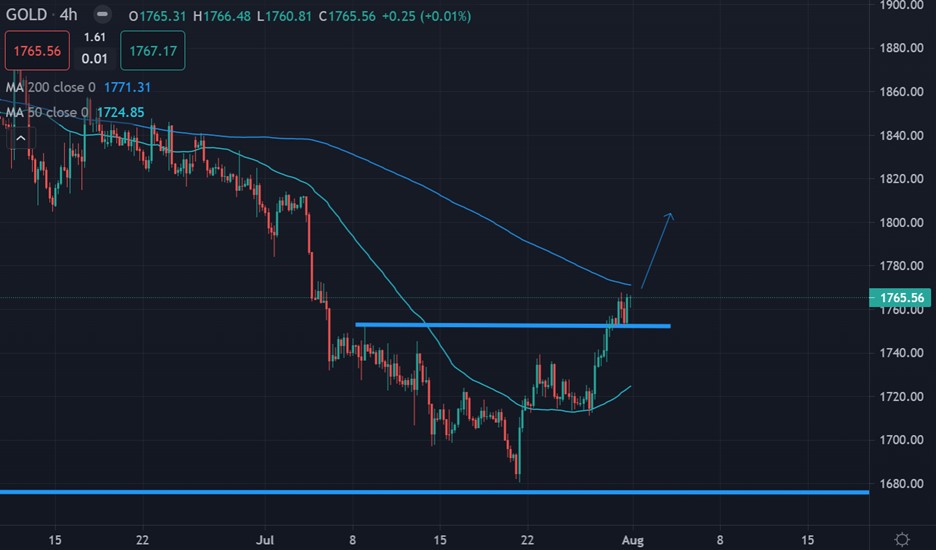
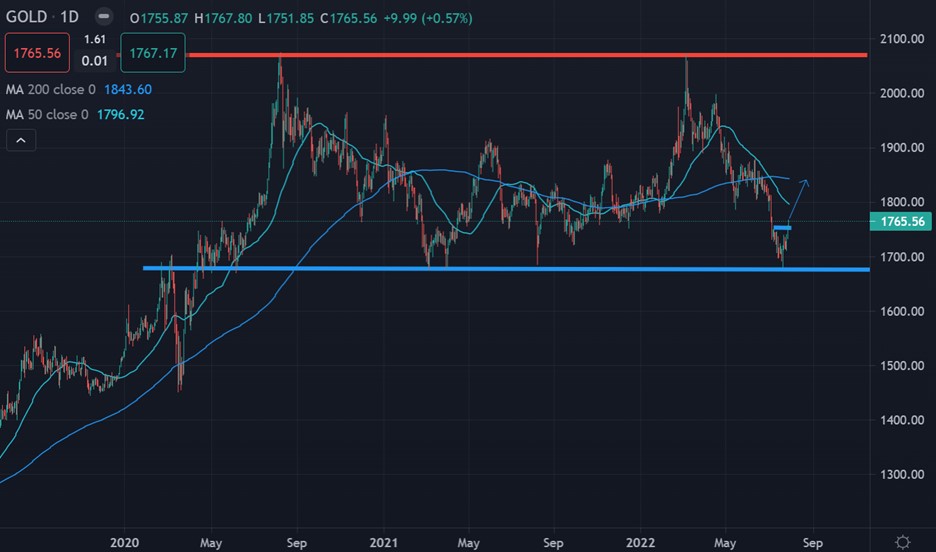
Technically, gold is poised for excellence. The recent breakout above $1,740 bodes well for a test of the $1,800 level. However, we must remember that the overall price trend is still down.
Unless we see the $1,840 level cleared then gold remains in a bear market, and a bear correction is what we are currently see. It will be interesting to see what happens if gold prices reach $1,800 or even $1,840 this week or this month.
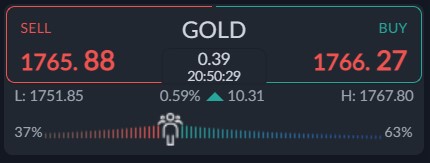
Sentiment is still rising slightly now. The sentiment skew is less extreme than over recent weeks, which is a positive force for a potential recovery in the price of gold this week.
Current sentiment metric towards gold show that traders are slightly more bullish. The ActivTrader market sentiment tool shows that 63 percent of traders are bullish towards gold.


