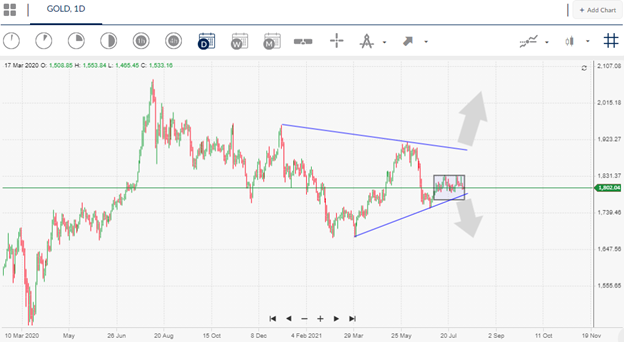
Gold could be preparing to make a big move on the metals market as the technicals and fundamentals are suggesting that the yellow metal is reaching an inflection point after weeks of price consolidation.
Market chatter over US Senators being very close to announcing the much-awaited United States infrastructure spending plan could propel the price of gold into a much higher trading range, as it will naturally be bullish for precious metals such as gold, silver, and copper, and US dollar negative.
United States policymakers pushed back the vote over the infrastructure bill to this weekend. US Senate Majority Leader Chuck Schumer appears to be moving to closer to passing the $1 trillion infrastructure package.
Fears over tapering being pushed back have also emerged after this week’s disappointment ADP Employment Change, which is often considered an early signal for the US Nonfarm Payrolls. Both developments are bullish for gold.
A soft number today could cause further problems for the US dollar and propel gold higher. However, it should be noted that rising coronavirus numbers from the US, China and Australia are currently underpinning the US dollar’s safe-haven demand.
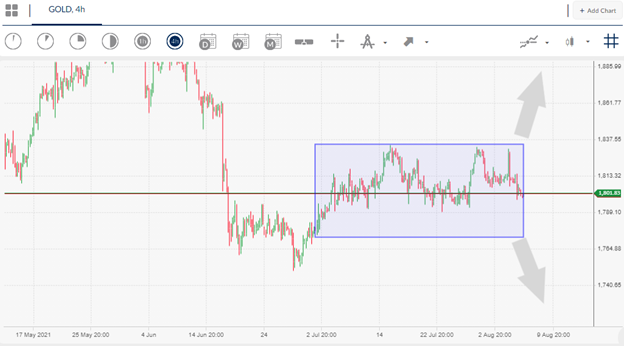
The technicals are indicating a break from the $1,780 to $1,830 price range is coming, and once a break takes place the next big directional move in gold is likely to take. Personally, I think gold could bounce sharply from the $1,780 area today, assuming the US Non-farm payrolls does not come in red hot.
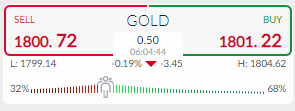
Current sentiment metric towards gold is currently suggesting further losses are likely in the near-term. The ActivTrades market sentiment tool shows that 68 percent of traders are still bullish towards gold, which is a bearish signal.


