Gold appears to have surged back towards recent highs due to the fact that the Bank of Japan suddenly started to pivot during yesterday’s Bank of Japan December policy meeting.
It should also be noted that inflation and currency fluctuations are going to add more volatility this year but for 2022 it’s safe to say that gold is one of the few safe haven assets that passed the test.
The era of sovereigns piling into USD reserves is not over, but it’s crested, and the marginal dollar may now find its way into gold. Central bank buying in Q3 data was strong and is likely to be the same Q4.
Combine that with the end of global central bank rates rises in next year and the looming eurozone debt crisis, the ongoing crypto crash and gold becomes a great alternative.
Other factors are also at play support gold gains. The United States confiscation of Russian currency reserves is a factor that should be a tailwind for gold over the long-term.
Technically, golds run back above its 200-day moving average is a positive sign. It is imperative that the yellow metals continue to make traction above this key technical metric this week.
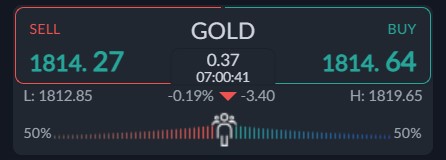
Current sentiment metric towards gold shows that sentiment has become neutral which hints that retail is not necessarily looking at gold gains this week.
The ActivTrader market sentiment tool shows that 50 percent of traders are bullish towards gold. Going forward, we really need to see a negative bias by retail to help the chances of a sustained recovery.
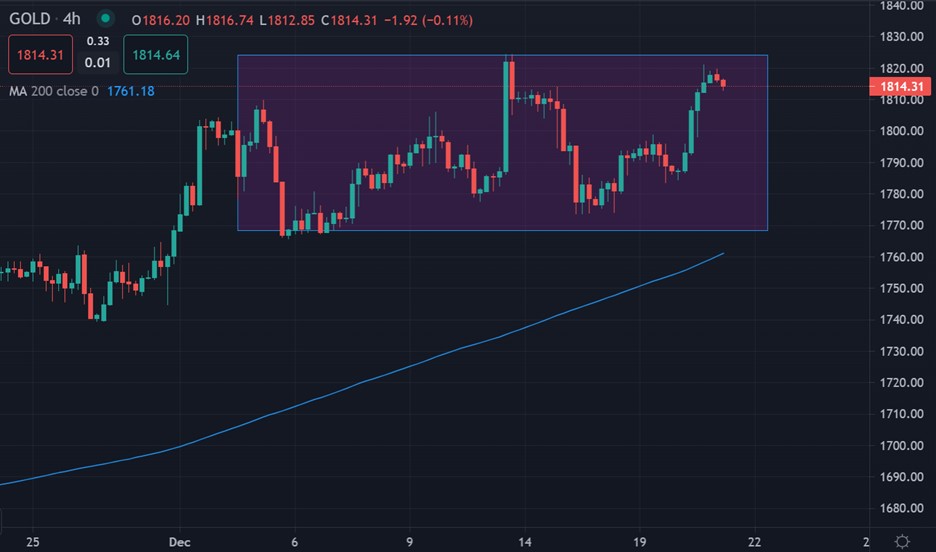
Gold short-term Technical Analysis
According to technical analysis gold the price of gold could be about to test towards the head of a head and shoulders pattern on the four-hour time frame.
These type of pattern invalidations are usually very bearish. In theory, if the restest of $1,820 holds then we could see a push back towards the range high, around $1,740 level.
A breakout above the head of the pattern could cause a surge towards the $1,850 resistance area.
See real-time quotes provided by our partner.
Gold Medium-term Technical Analysis
The daily chart shows that the yellow-metal has moved back above the neckline of an inverted head and shoulders pattern and is starting to make traction above its 200-day moving average for the first time in nearly 6 months.
We could see the price of gold revisit the top of its range again around $1,875. However, before that the price of gold has an important battle with its 200-day moving average, around the $1,800 level.
See real-time quotes provided by our partner.