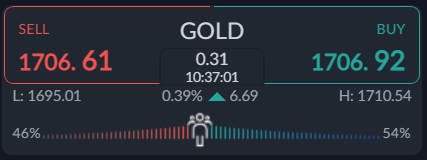
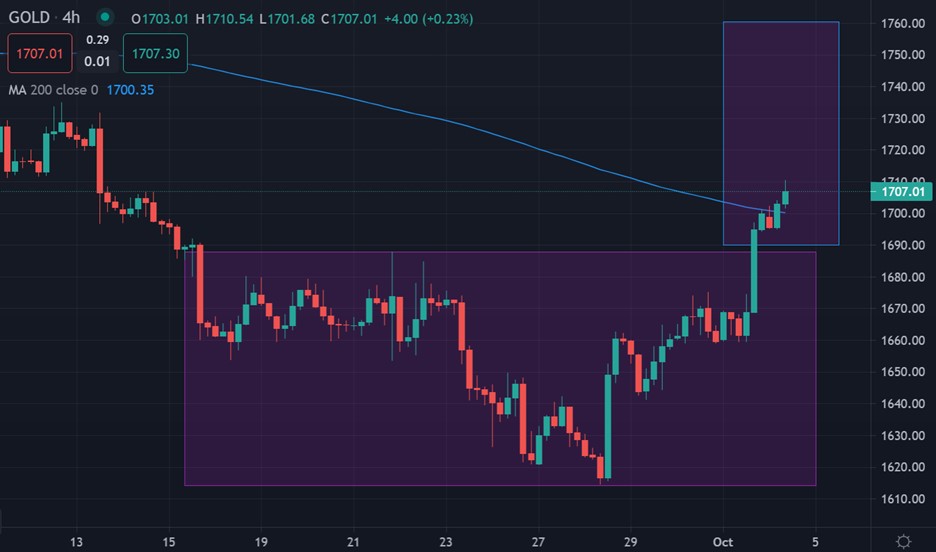
Gold prices have recovered above the $1,700 level after the yellow metal saw renewed momentum as weak manufacturing activity in the US drives safe-haven demand for the precious metal.
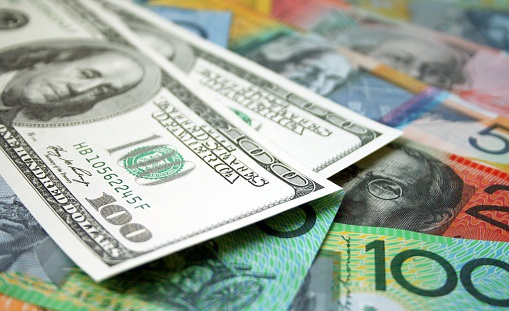
The latest data from the Institute for Supply Management shows manufacturing activity barely holding in expansion territory in September. This caused a big decline in the US dollar.
The ISM manufacturing PMI fell to 50.9 % last month, missing expectations and down from August’s reading of 52.8%. Economists were expecting to see relatively stable activity at 52.5%.
The report noted that activity is at its lowest point since May 2020 when the global economy was roiled as nations implemented strict lockdown measure due to the COVID-19 pandemic.
With the inverse relationship gold shares with the US dollar index, it is possible that further upside is possible. This is especially so if we see the US dollar index cracking the 110.00 level.
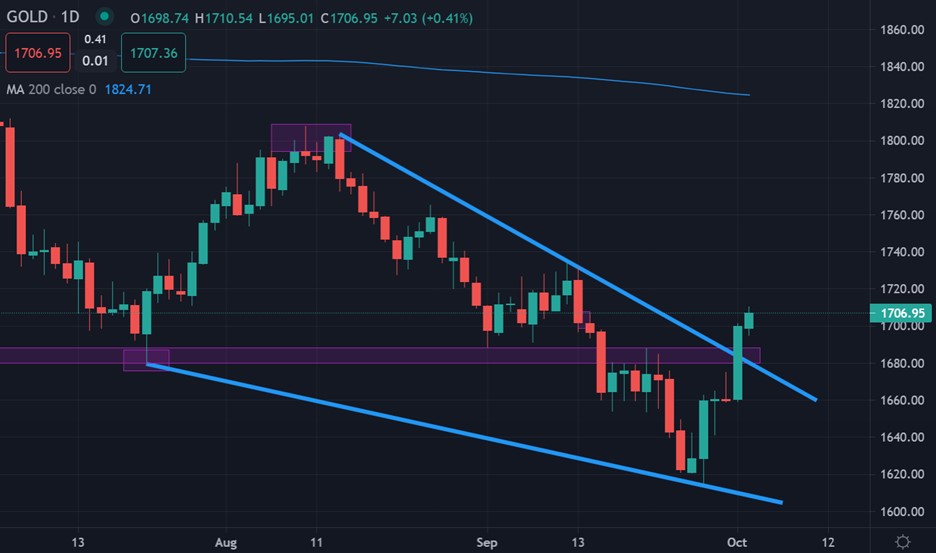
Traders should be very cautious towards this recent price rise if the $1,680 level remains breached and gold starts to stabilize above this key former breakout zone.
Current sentiment metric towards gold shows that sentiment has remained the same since last week, which could hint an eventual bearish breakdown in the price of gold.
The ActivTrader market sentiment tool shows that 54 percent of traders are bullish towards gold. Going forward, we really need to see a negative bias by retail to help the chances of a sustained recovery.
Current sentiment metrics may make do not make it difficult for gold price to rally, especially with this key tech levels now broken.
Gold short-term Technical Analysis
According to technical analysis gold the price of gold has ignited inverse head and shoulders price pattern with significant upside potential forms on the four-hour time frame.
According to the size of the mentioned price pattern the price of gold could rally by a further $60.00, taking the price of gold down towards the $1,760 resistance level.
See real-time quotes provided by our partner.
Gold Medium-term Technical Analysis
The daily chart shows that the yellow metal fast broken from a falling wedge pattern. These type of price patterns are known to be amongst the most bullish reversal patterns.
Looking at the bullish pattern and the fact gold is in bear market, at a very minimum, we could see the price of gold moving the $1,750 level, or even higher around the $1,820 towards its 200-day moving average.
See real-time quotes provided by our partner.