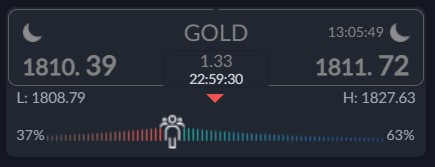
Gold is starting to take a tumble due to expectations that the Fed are likely to raise interest rates by 50 basis point at the next policy meeting after the last super strong PCE report.
The PCE gauge from the US is actually the Fed’s preferred measure of inflation, adding further credence to the notion that inflation is not coming down and the rate hike cycle is alive and well.
Other developments are also taking place. The central bank of China is printing huge amount of money. Last week they embarked on the largest injection of money into the market in memory.
QE was a primary driver of gold prices during the last bull cycle. If the PBOC embark on a long cycle of liquidity injection like the Bank of Japan it could really help boost the price of gold.
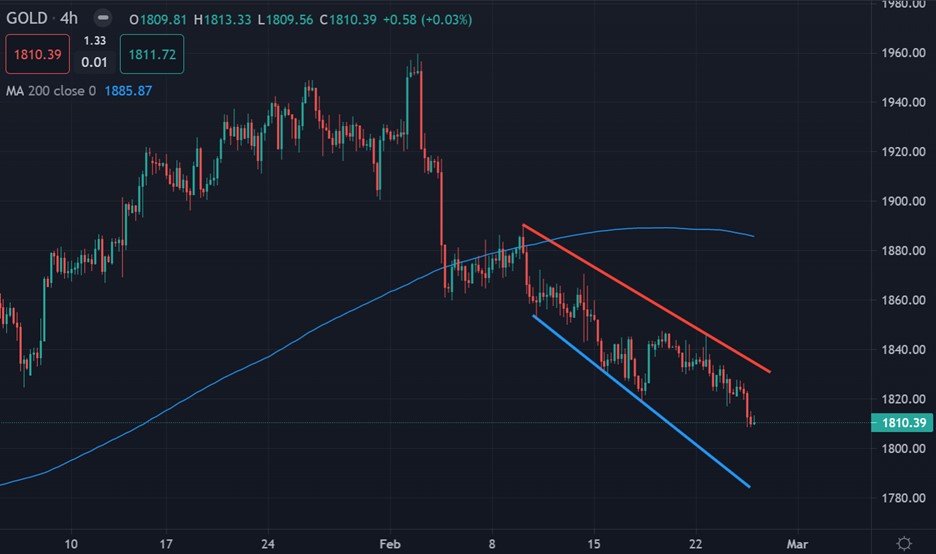
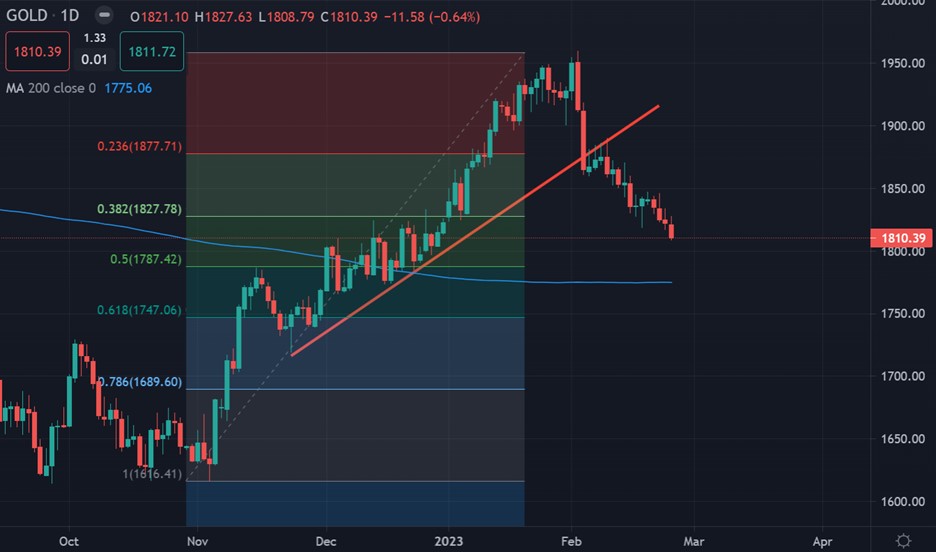
Technically, I would suggest keeping a close eye on golds 200-Day MA and the 50 percent Fibonacci retracement level this week. This could be the area buyers start to accumulate gold if.
Personally, I still think gold is going major bull trend and traders will move away from the US dollar this year and move into gold, with the yellow metal eventually hit $2,200 to $2,500.
Current sentiment metric towards gold shows that sentiment has become slightly more bullish, which hints that this current price correction is probably not over just yet.
The ActivTrades market sentiment tool shows that 63 percent of traders are bullish towards gold. Going forward, we really need to see a much strong negative bias by retail to help the chances of a sustained recovery.
Gold short-term Technical Analysis
According to technical analysis gold the price of gold has moved lower after sharply over recent days and is trapped inside a bullish falling expanding wedge shaped pattern.
The bottom of the wedge is found at the $1,780 level, which also converges perfectly with higher time frame technical support.
It is also noteworthy that bullish momentum divergence has formed, which is likely to see a final moving towards the and then above the $1,900 resistance level.
See real-time quotes provided by our partner.
Gold Medium-term Technical Analysis
The daily chart shows that the yellow-metal has moved back inside its two-year range and could test back towards its 200-day moving average, around the $1,780 support area.
We could see the price of gold revisit the $1,780 level also because it is the 50 percent retracement of the entire price correction from $1,950.
See real-time quotes provided by our partner.